Cloud vs CDN… Are CDNs always an improvement?

During the last years we have witnessed an explosive evolution in how the Internet is structured. Although traditional hosting and content delivery is still the norm in most cases, its basic function has been enhanced by CDNs and the advantages of cloud computing when we need to optimize our service’s presence.


On one hand, CDNs have built themselves a reputation of speed, power, “freedom”, space, air…which reflects on their market names as well: Fastly, Highwinds, CloudFlare, Skypark, Cachefly, etc. You get the idea. In many cases the technical results do reflect their marketing images, in most situations adding a CDN will probably benefit your site… but is it always like that?


On the other hand we have Cloud Computing services have improved and matured a great deal, while at the same time can offer either their own CDN connectivity or simply it’s easy to hook one up. We have found that, even without CDNs some cloud services work at CDN-like speeds and it seems that adding one won’t bring noticeable speed boosts.


We take the case of DigitalOcean as cloud provider. Famed by their approach as a simple and clean environment and low costs, we could observe remarkable speeds in the UK using our tool CloudPerf.


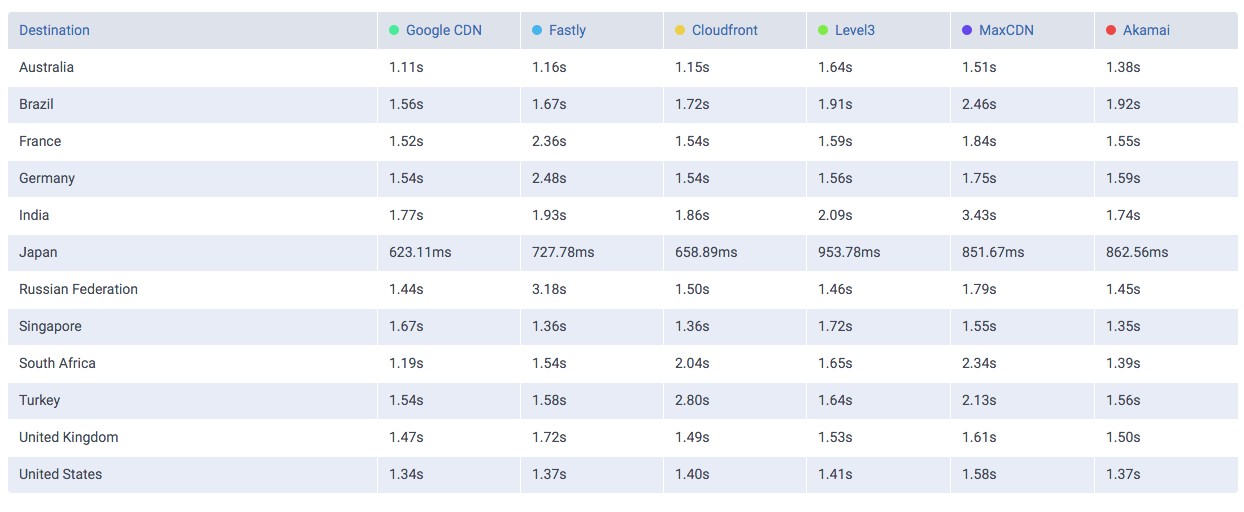
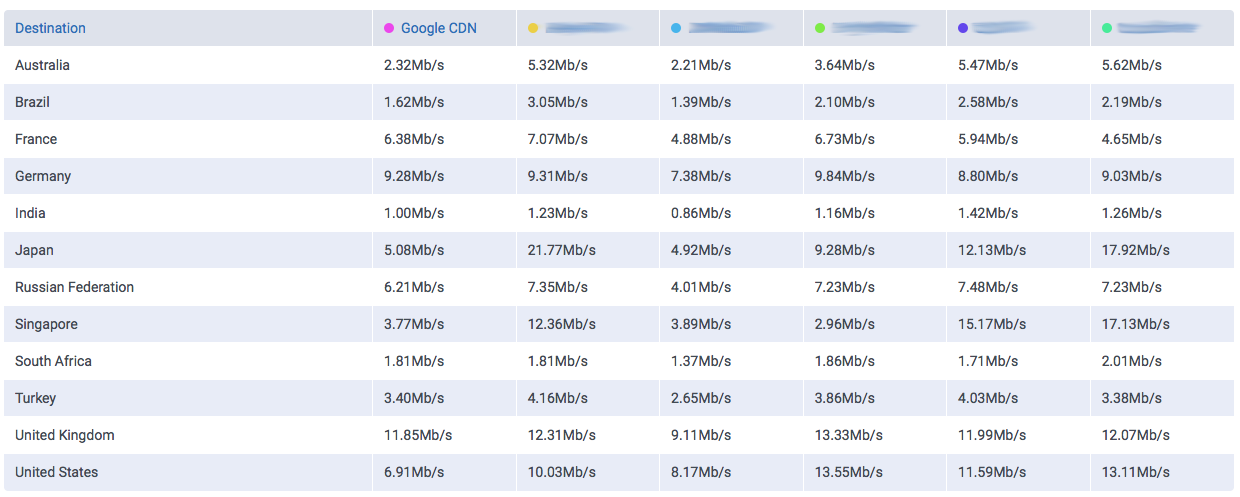
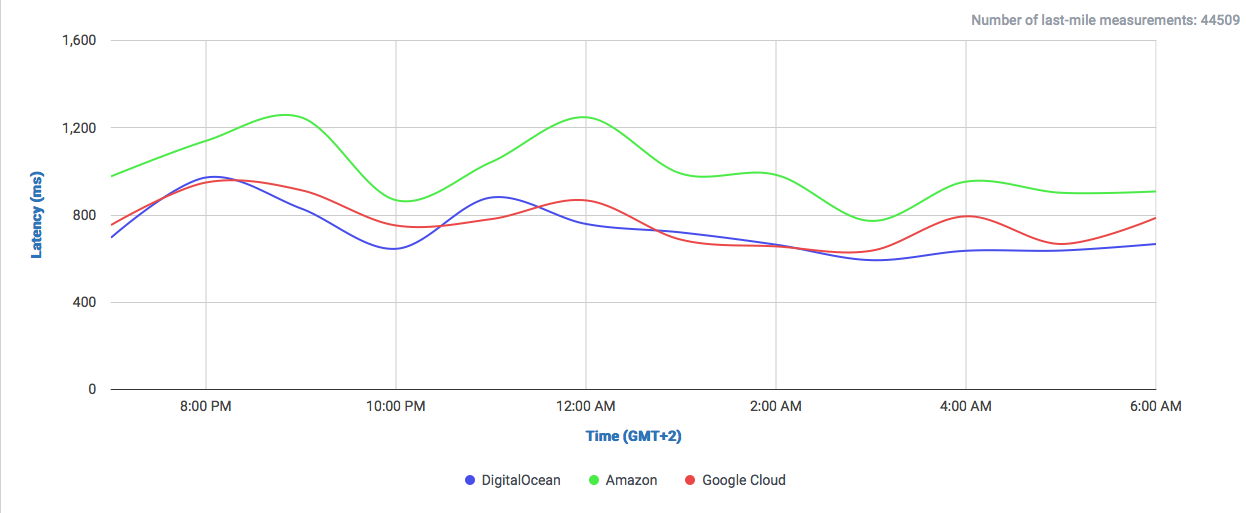
In this graph we can observe how DigitalOcean compares to Google and Amazon (without CDN) in a single 1MB object download.

DOvsGoogvsAma-httpget UK

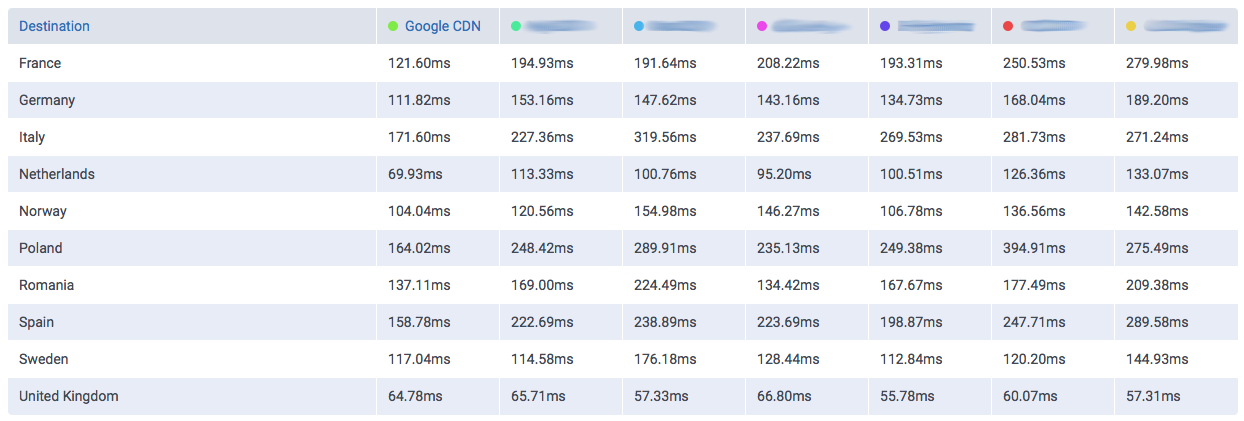
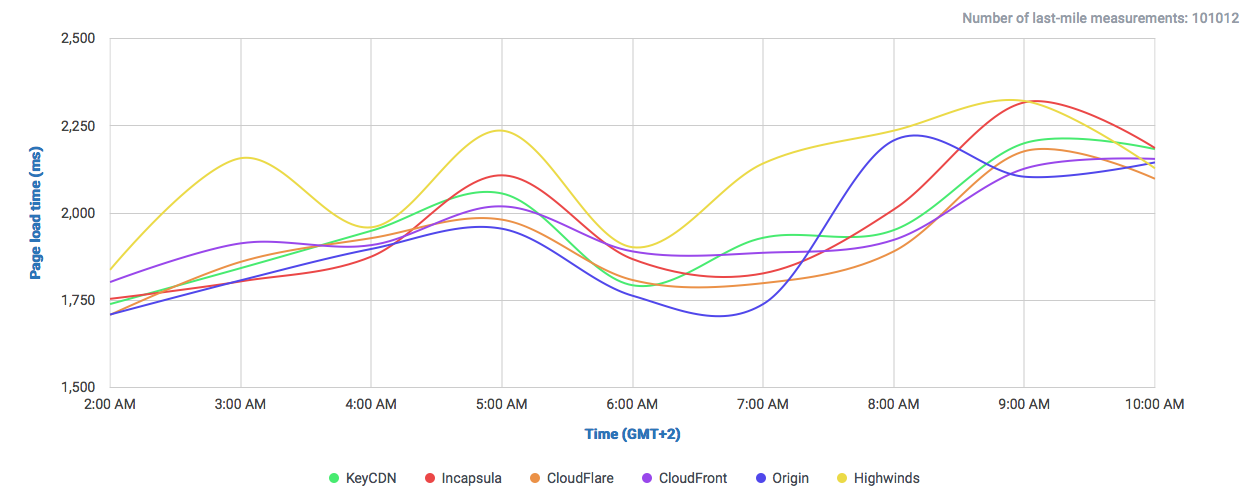
We set-up a simple web-page for comparing the time it takes to load a whole page.

DOvsGoogvsAmaz pageload
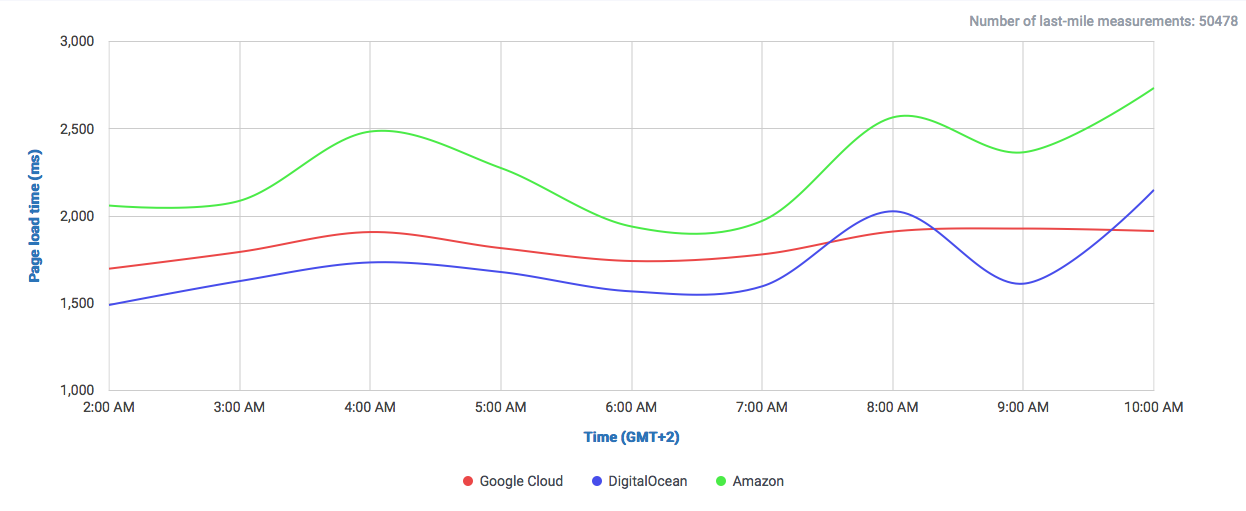
We can already observe a clear difference to both giants Google and Amazon. Both offer their own CDNs which will speed up their service, even locally. But why not get a cheaper and already fast solution?


Especially for local audiences, like this case in the UK, there could lie a very cost-effective solution for delivering low-latency content. So why isn’t this the case? One factor could be the simple, developer-oriented approach of DigitalOcean, which can be beneficial for somebody who knows how to do everything by hand, but the benefits of using a big multi-service Cloud-Provider like Google or Amazon are something you also pay for: being able to interconnect services, easy application-level management, auto-respawning of faulty machines and overall an easier management among many other interoperable options need to be taken into account… especially if you have a relatively complex machinery to operate.


You could mount a very complex network in DigitalOcean as well, but you would need to configure everything by yourself and management ends up being more tedious. In that sense, depending on your budget, sometimes paying less on one side can result in higher operational costs. Please take into account that we are actually comparing a VPS solution against complete Cloud service providers.


On the other side, DigitalOcean is an example of how the Cloud is becoming more and more affordable, to the point where it competes against traditional web-hosting prices and still delivers high performance. You can literally have a new server up and running in less than a minute and maybe 5 minutes if you’re new to it. Since there isn’t much to fiddle around, this very straightforward and simple approach will spawn you one or more new servers instantly, with public ip-addresses and pre-installed keys to log in remotely by ssh. Starting from $5 a month for a basic VM running on the Cloud.


Even if you already use another Cloud provider to run your machines, trying this out won’t hurt at all. Hooking up a CDN to it is very simple and even IF you need it. Since the high performance of the service itself is already on-par with CDNs, you can think it twice if it’s truly beneficial to use one.


This is a point we would like to stress: a CDN by itself may or may not accelerate a service. The decision of which CDN to use and whether it fits your own user distribution is a complex question which requires a well researched individual answer for each case. Having stated that CDN isn’t synonyms with “higher speed”, we woud like to ask again: why isn’t this option more popular? Maybe is it the already established usage of a Cloud platform, which makes it convenient to just spawn a machine and control everything from the same place. Maybe adopting another provider is too much extra papework, or maybe the public simply isn’t aware of this.


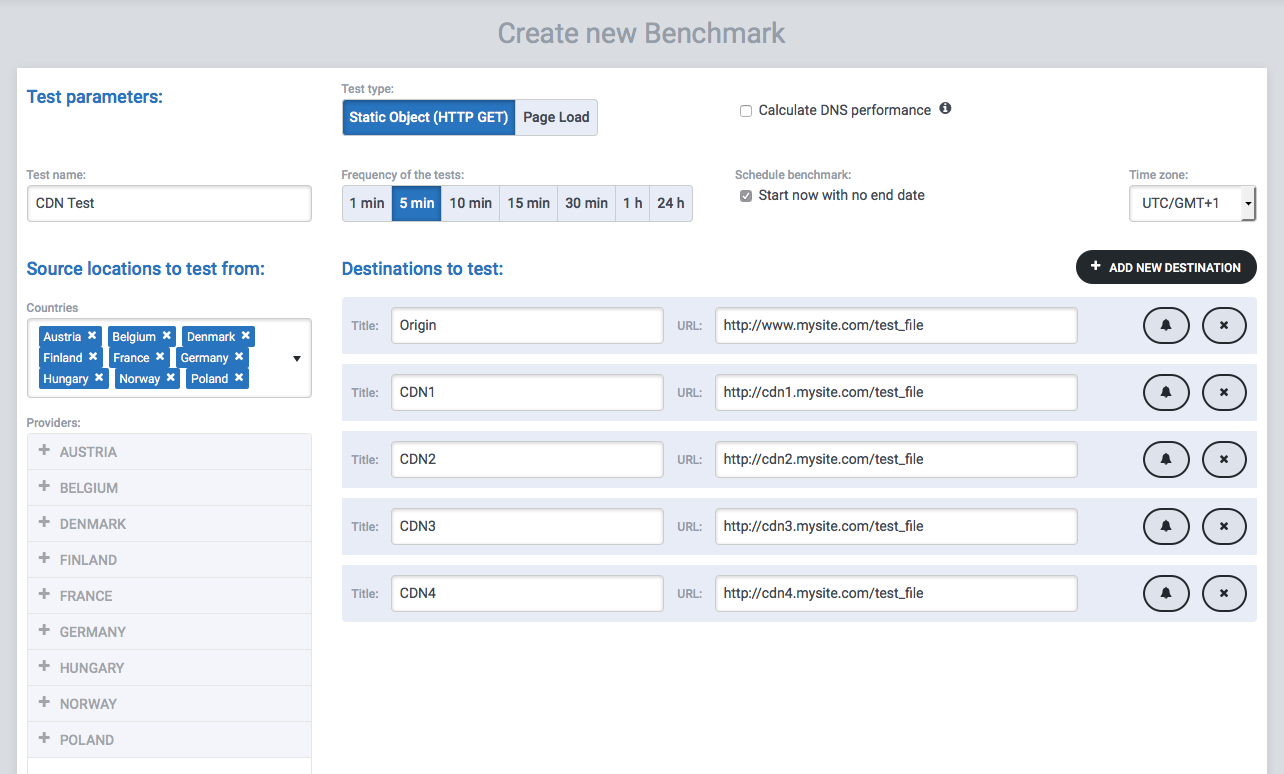
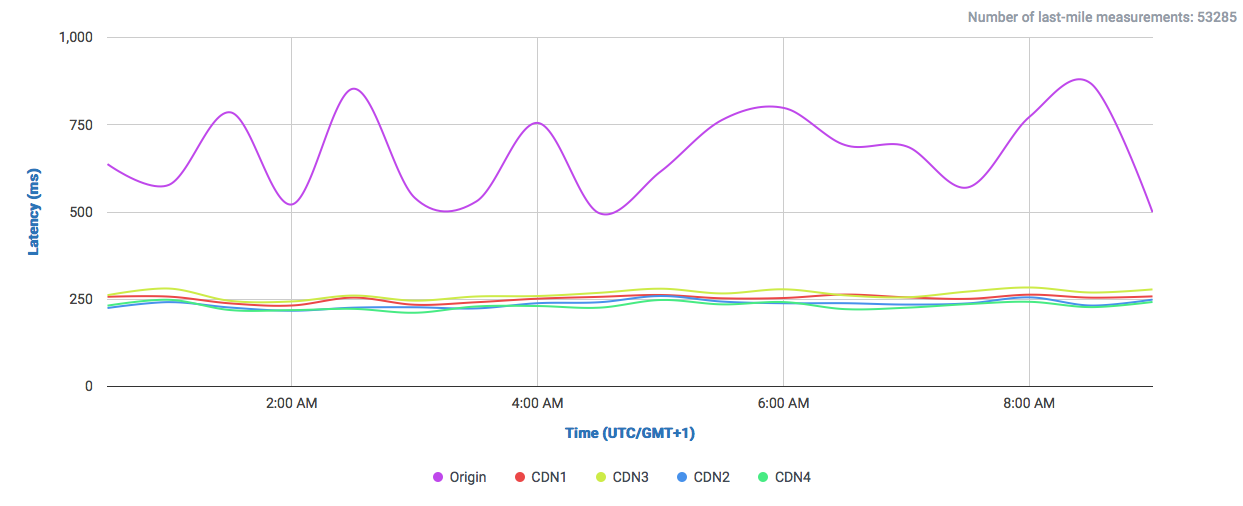
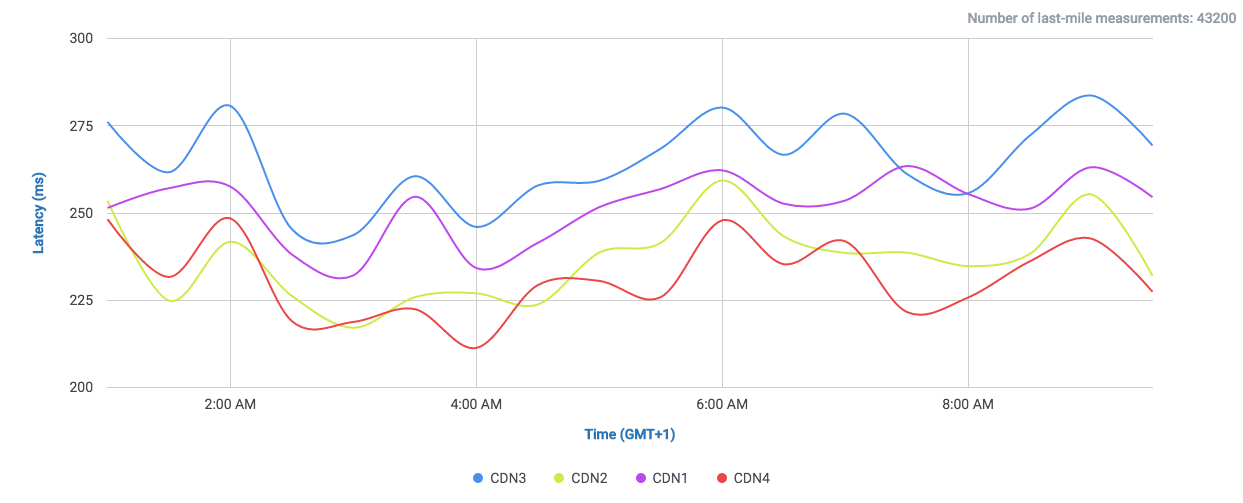
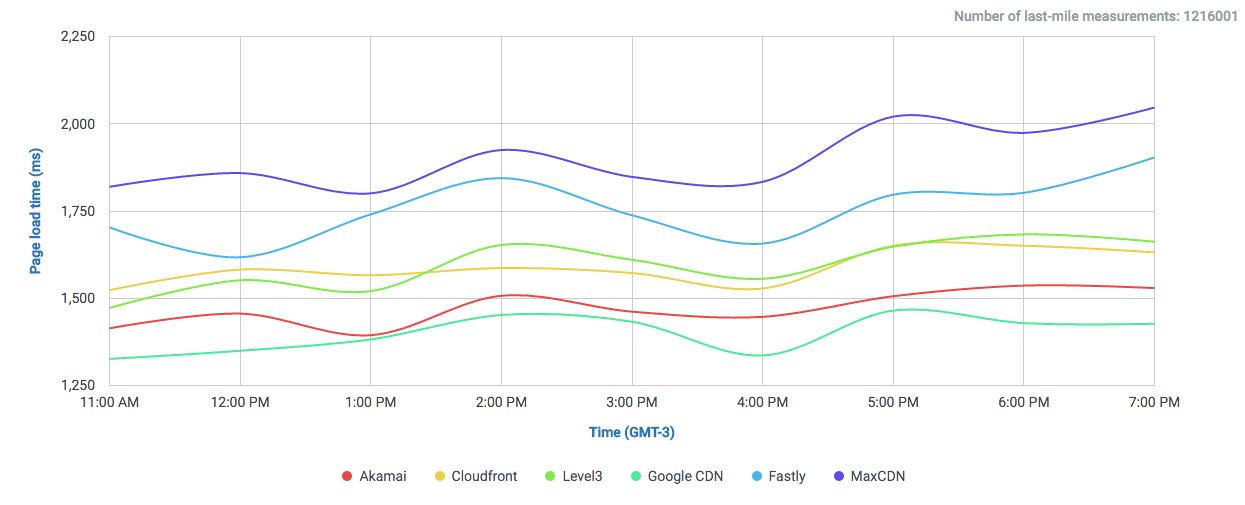
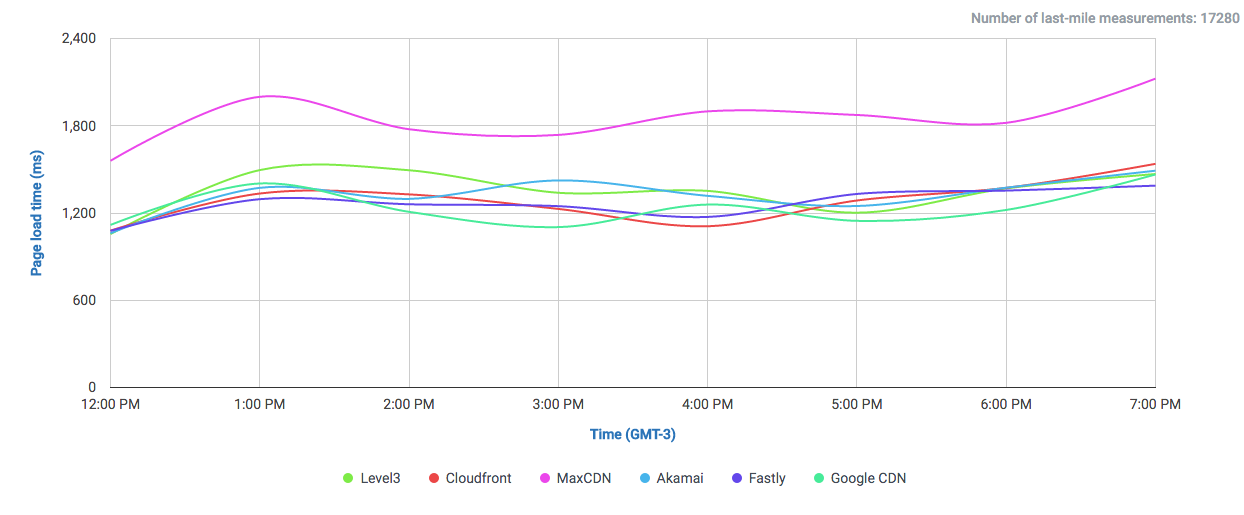
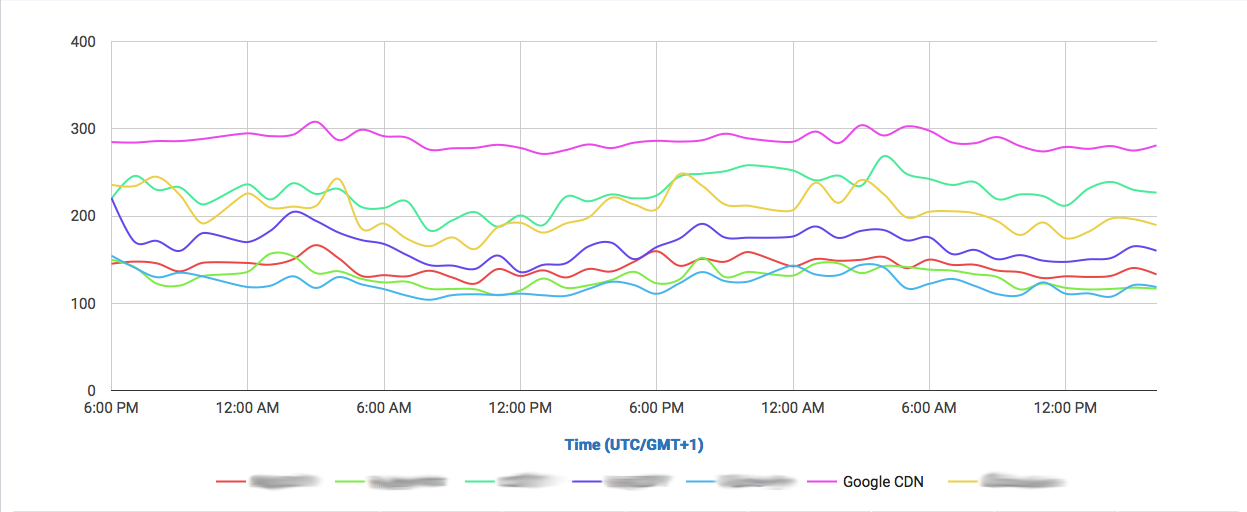
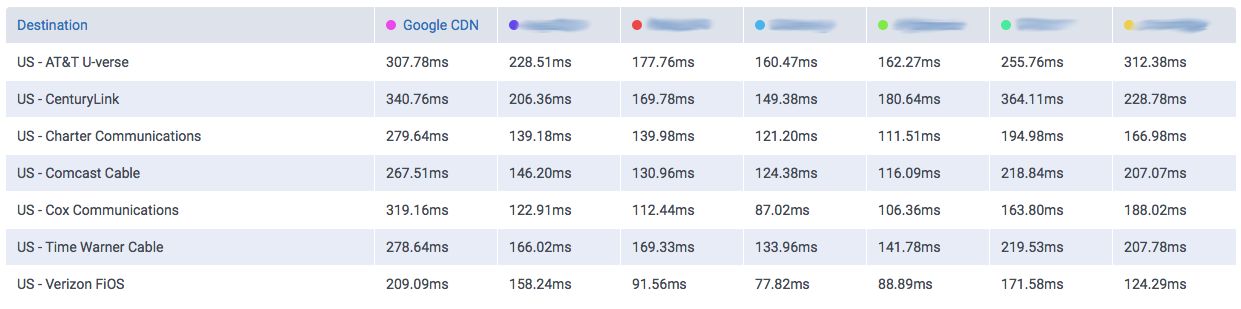
Let’s take a look at the following comparisons, where CloudPerf measured DigitalOcean against multiple CDNs in the UK:

DOvsCDN-httpget UK

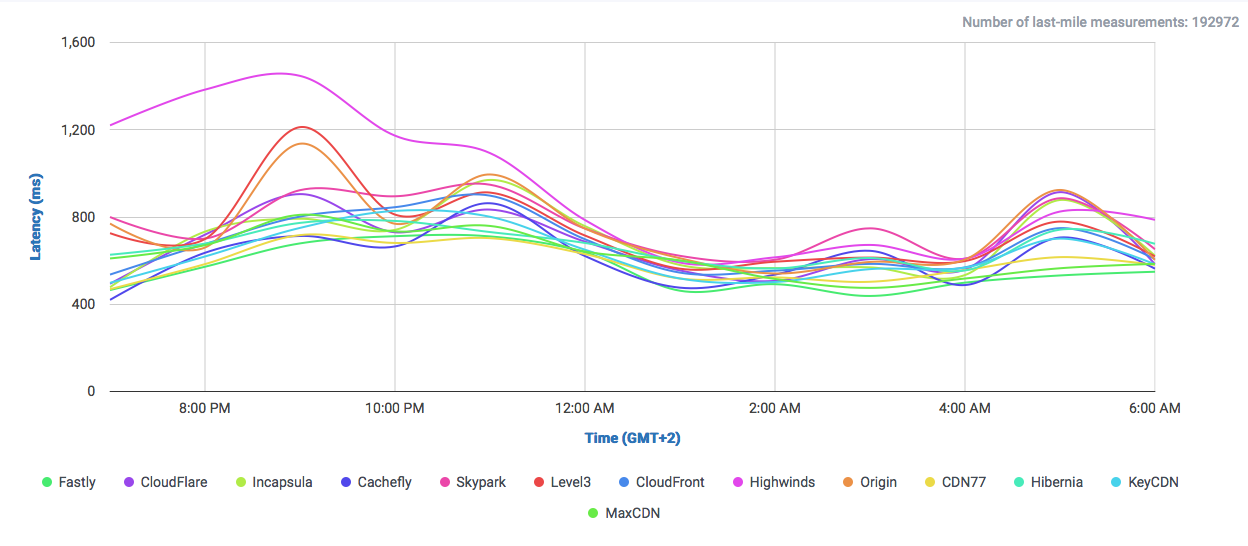
If we compare DigitalOcean’s (here labeled as “Origin”) performance in the UK directly against CDNs we will find that it is at least on-par with most of them.

DOvsCDN pageload all

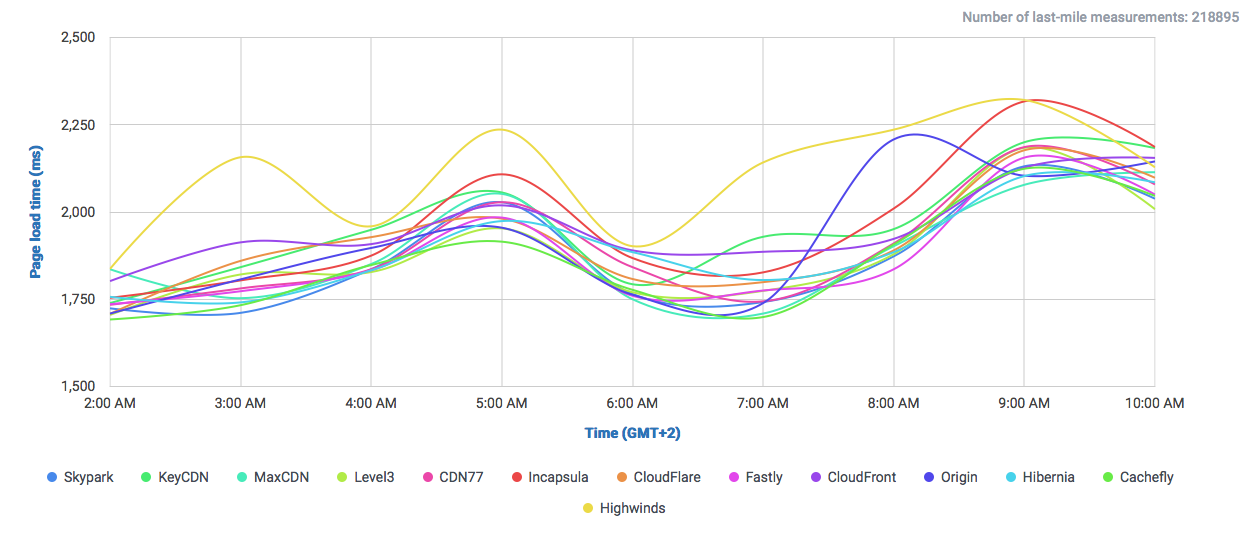
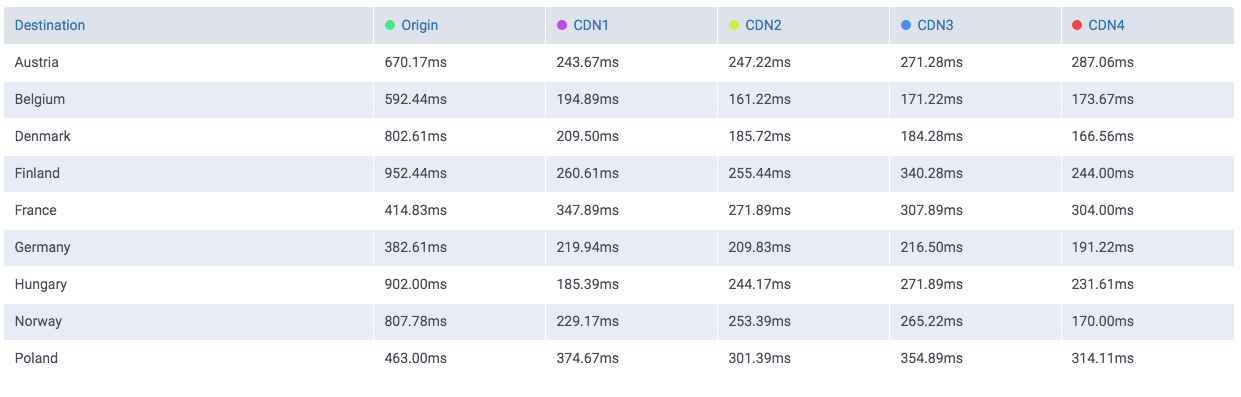
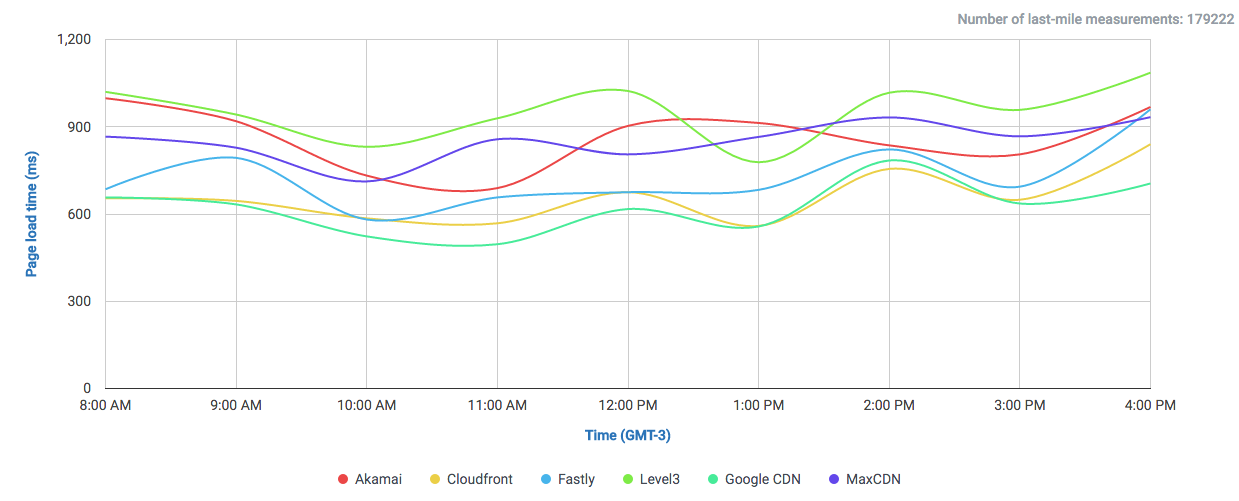
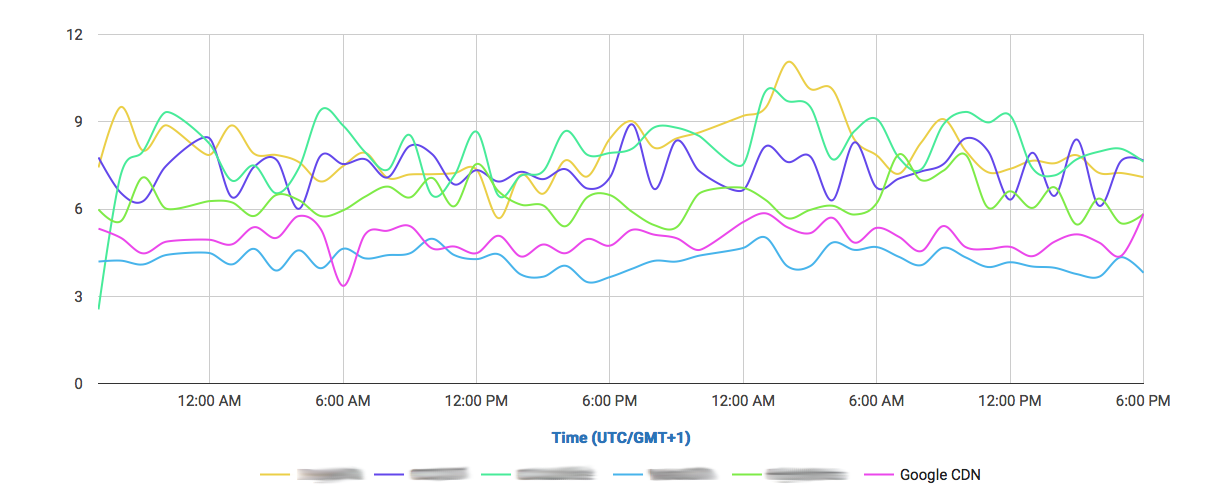
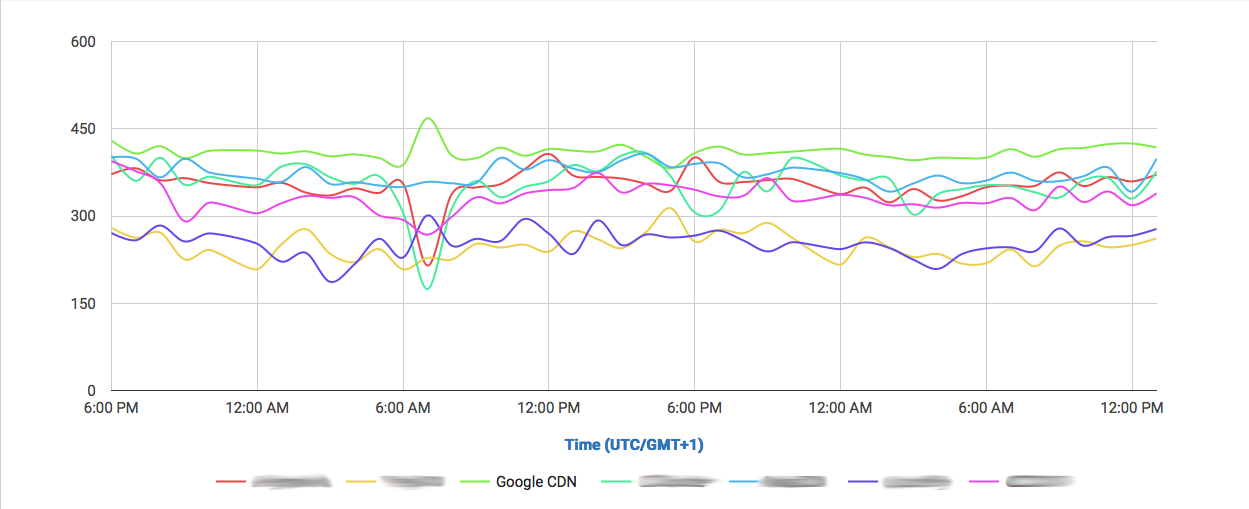
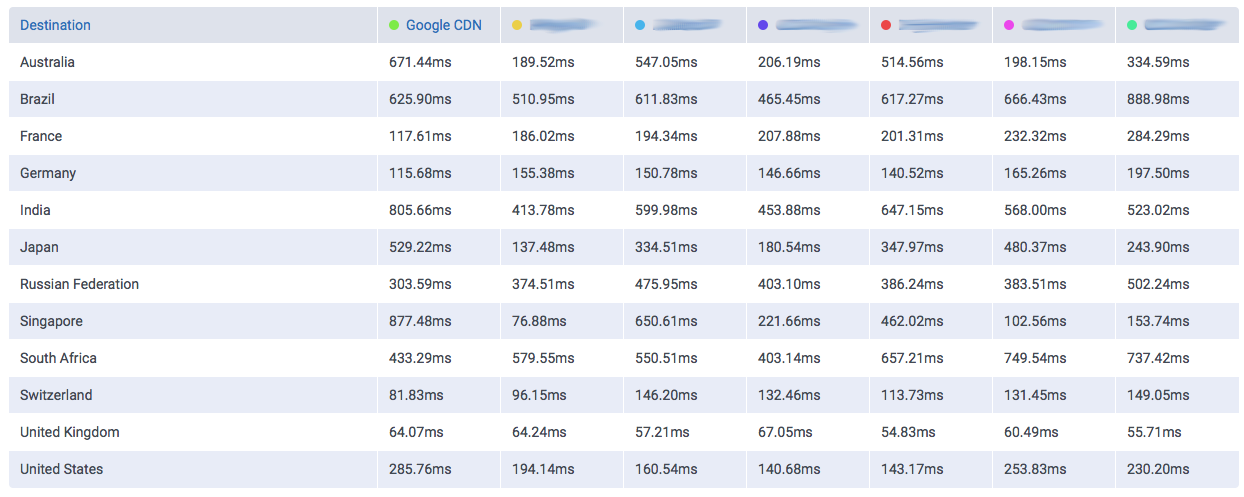
And if we filter out most of them and take a look to the CDNs performing the closest:

DOvsCDN less

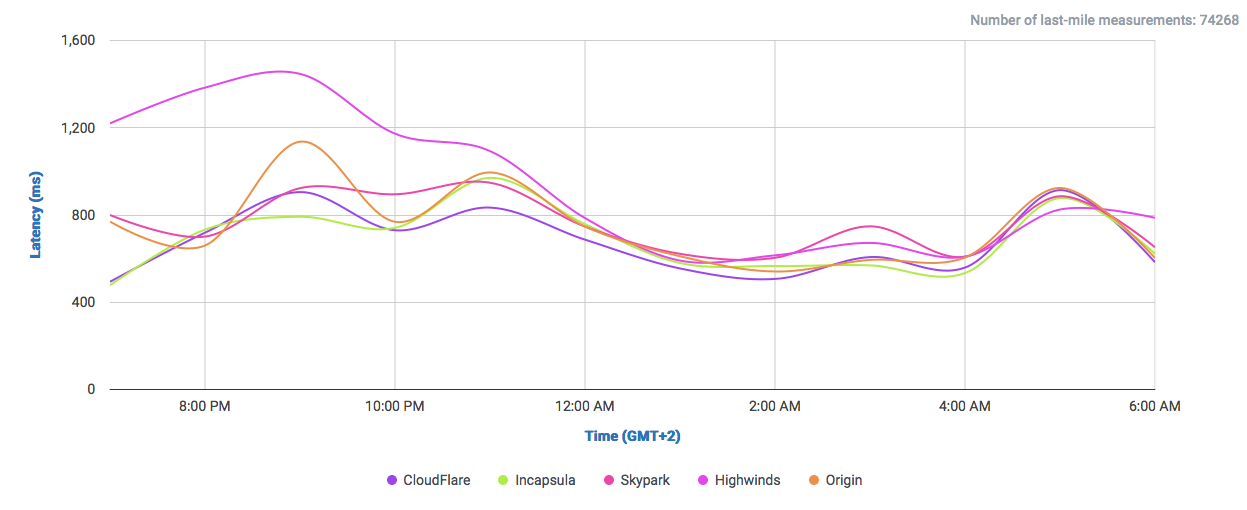
We find that it performs even better than Highwinds and Skypark. With CloudFlare and CloudFront performing with better averages.

DOvsCDN pageload less

So, looking at the example we showed here, if you have your audience near any DigitalOcean location, then you’re probably not going to need a CDN to speed up you service. Nevertheless, depending on what solution you adopt, you could benefit from other features of CDNs, like added SSL security and easy escalability without having to resize machines in many cases.


When we compare prices, the picture gets even more interesting. Let’s take DigitalOcean’s $20/month package: you get 3TB of data transfer included and a generous VM. That’s $0.03 per hour and $0.0067 per GB together in one price. A similar configuration in GCP will cost approx. $28.08 only for having the VM and ~$460.8 for 3 TB of traffic, that makes ~$488,88 a month. In AWS a similar config would cost ca. ~$40.32 for the VM and ~$476.16 for 3 TB of traffic, that’s ~$516.48. So DigitalOcean with $20 a month will give you an equivalent of ~$500 investment in other platforms.


What about the bigger VMs? The biggest plan DigitalOcean offers is $640 a month for a very capable machine and 9TB data transfer included. An similar setup in GCP will cost ~$449.28 ($0.624/hr) plus $1024 for 9TB of traffic giving a total of $1473.28. In AWS you can either choose a $0.528/hr which is a less capable machine but similar in price or $1.056/hr for a more similar one to the ones used in the competition. 9TB of data transfer will cost $1428.48 and running the VMs will cost either $380.16/month or $760.32/month, giving a total of ~$1808.64 for the smaller machine or ~$2188.8 for the bigger one. In any case expect to pay around $2000 a month. All that without CDN. To make things simpler, if we assume an approximate price of $0.1 per GB in a CDN, we find that you have to put $300 or $900 on top of your already existing hosting costs for accelerating those 3TB or 9TB of data respectively.


Please take into account that these figures are an approximate calculation since, as you may very well know, pricing in Cloud services and CDNs is extremely dependant on what resources, how and when were they used. In that sense, this also favours DigitalOcean in giving you a clear and straightforward fixed pricing structure.


Summing up, we have seen that a simple Cloud VPS provider like DigitalOcean can achieve very low latencies locally in the UK. We compared its performance and pricing against Google Cloud and Amazon S3. We saw that DigitalOcean generally performs better than both. Then, comparing DigitalOcean’s performance against CDNs serving the same content, CloudPerf reported that the VPS by itself is fast enough in the UK to compete head to head against CDNs. In this perspective, we can only recommend to analyse and think twice what kind of solution you need to adopt. For that matter, making an informed decision without measurements sounds indeed contradictory. Using our tool CloudPerf, we discovered particular circumstances where a large very important location like the UK can be covered simply using a modern high-performance Cloud VPS service.


Do you want to discover your best options yourself using CloudPerf? Sign up now!

Measure and compare CDNs with CloudPerf

In this tutorial we show you a practical application of CloudPerf, which is measuring and comparing CDNs. Since nowadays the CDN market is bigger than ever and equally diverse, we think it is very important to be able to compare and analyse CDN performance using an independent measurement platform before making any decision. This way you can see and compare by yourself using the same measurements across all providers of your interest.


It is important to take into account, that CloudPerf makes last-mile measurements, that is, right there where your users are. That is especially useful to contrast what CDNs or other providers say about their services and what your users are actually experiencing in real time.

Preparing your setup

    •  Make sure you have an account with CloudPerf, if not, you can get a free trial account on this link.
    • Make a list of all the URLs you would like to measure directly from your site. In this example we will use only one url to compare with four CDNs.
    • Make sure to compare a copy of the same file across all destinations.
    • Make sure all your URLs use the same protocol (http or https).
    • Set up your test domains for measuring your service with your desired CDN. You can get trial accounts on most CDNs. You can also setup a series of subdomains for testing many different CDNs with your content. So subdomain1.mysite.com is linked to CDN-1, subdomain2.mysite.com is for CDN-2 and so on.
    • Confirm that all your testing sites are using similar DNS configurations. CNAME cascading can affect measurements greatly and lead to unrealistic results.

In general, keep in mind that for testing purposes, it is best to configure all links as similarly as possible. Depending on the options each CDN gives, most of them can also provide test files for comparing their services. Some of these test files can also be found in the web. Nevertheless, we think that measurements are more meaningful if you test directly with your content. Especially if your site mixes cached and uncached content or if your site updates frequently, caching times become more relevant in the equation.

Screen Shot 2016-04-20 at 17.31.48


* NEW * – CloudPerf now offers pre-configured links to popular CDNs for your convenience. Just click the drop-down menu on the “Create New Benchmark” button in the Dashboard and select “CDN Benchmark”. The benchmark editor will now include a list of checkboxes with popular CDNs so you can compare your own destinations with our current selection of CDN providers. We will be adding more and more CDNs with time!


Configuring CloudPerf

In this example, we will set up a comparison between one static object against 4 CDNs. Once you have everything prepared, log in to CloudPerf and you will be taken to the Dashboard. Click on “Create new Benchmark”. You will be taken to the benchmark editor.

Screen Shot 2016-03-23 at 01.00.41
We name this benchmark “CDN Test”. We chose to measure a Static Object, but this example is also valid for using Page Load. Since we want to run the test for some hours, a 5 minute frequency is OK. For longer or permanent tests, you may want to measure less often. We select a number of countries in which we are interested to run the measurements.


CloudPerf uses a technique we call “Connection pre-warming”, in which two subsequent requests are made with every measurement: the first request will need DNS resolving and therefore will report longer measured times, while the second request has already a resolved DNS and will only report the connection time to the server. You have the option of including the DNS lookup time in your results.
This time we choose not to include DNS lookup times in our measurements, so we can observe in our results the “pure” connection time to our destinations.


For the first destination, we input the direct link to our origin server against which we will compare the CDNs’ performance. We chose to name it “Origin” and under URL we input naturally the direct link to the file we will test. Click on “Add new destination” and another line will appear. We name this and the subsequent lines with the CDN’s respective names, in this case, we simply numbered them. In the URL box we put either the address of the subdomain you previously configured to work with your site or any other link to a static object or web page to measure. For this post we compared one of our homepages with four real CDNs serving the same file.

Screen Shot 2016-03-23 at 01.15.06
Click on “Save & Update” and voilà! We have configured our benchmark to measure our site and some CDNs simultaneously from thousands of different locations. We only have to wait now and take a look at the results after enough samples are taken.

Viewing Results

If enough time has passed, our first results will be ready. We simply log back into CloudPerf and once in the Dashboard view, we click our measurement’s name, which will take us to the results page.

By default we see first the latency measurement graph. The first thing we can notice from these results is that using any of those CDNs will make our website more responsive.

Screen Shot 2016-03-23 at 11.16.36

If we remove the origin from the graph using the destinations buttons, since it is the slowest URL in this experiment, the graph will automatically zoom in and you will be able to observe and compare all four CDNs much more clearly. Please note the color change of the graph lines after modifying the destinations.

Screen Shot 2016-04-20 at 19.00.43

You can use the results table below for having a first look at the measured latencies by country.
Screen Shot 2016-04-20 at 19.03.24
If you wish to see the measurements over time in the countries of your interest only, you can select them using the Tests Running From field. You can also switch the graph between destinations and location using the Group By option.


It may be very intresting to compare results using different statistics. For example, if we select the 25th Percentile (faster connections) we can observe that CDN4 clearly outperforms the other three CDNs:
Screen Shot 2016-04-21 at 00.49.02
while selecting the 95th Percentile (slower connections) our results show us longer latencies, but less clear differences between CDNs, although maintaining the general tendencies among them.
Screen Shot 2016-04-21 at 00.54.49


Remember that CloudPerf is a very flexible tool and can be used for much more than measuring CDNs. Please take a look at our Quick User’s Guide and explore all the powerful options that CloudPerf has to offer!


Sign up now!

Google CDN Beta is here… and it’s already one of the fastest CDNs out there!

servers-cloud-600x450
Some months ago, Google launched their Alpha program for their upcoming CDN service. We kept a close eye to their development and in the meanwhile, in NEXT 2016 Google has already announced the Beta phase of their CDN. We already discussed how this new product will fit in the broad palette of content distribution solutions Google has implemented. We have seen Google Global Cache, which is primarily aimed at speeding up their own services at ISP level, with more than 800 caches installed globally. CDN Interconnect is their partner program with third party providers like Cloudflare, Level3, Akamai, Highwinds, Fastly and Verizon, allowing them to use Google’s backbone network to transport content faster than ever from the source to practically anywhere where it is required, powering up CDNs not only with faster caching, but also enabling them to deliver rapidly changing content at top speeds.

Cloud CDN is Google’s own CDN solution for sites running in VMs inside Compute Engine. It is designed and implemented a bit differently from other CDNs, since it is meant to cache not only static content, but practically a whole site in more than 50 edge caches globally. It is a whole new take in the concept of CDNs, going way further than simply caching files, since it is directly integrated into their Load Balancing system and it literally means that a copy of your site will be running and serving from the closest location to your customers, with a single public IP address thanks to Anycast. In addition to HTTP/1.0 and 1.1 it also supports the new HTTP/2 protocol as well as free HTTPS, putting your site at the edge of current Web technology.


basic-edge-cache

Using our tool CloudPerf, we were able to try out and see how well it performs compared to other CDN providers, including some of their Interconnect partners. We have four exact copies of our test VM in Google Compute Engine running in different locations worldwide. Since Cloud CDN is designed to run in front of a whole site, instead of only caching static objects, we designed a simple 100kB page to test this system at its best capabilities. CloudPerf uses a real instance of Chrome to load the whole page and measure the time it takes to visualize the content in a real web browser, measuring as always from the last mile, where real users are.


Please consider that CloudPerf‘s Page Load test, by using a real instance of Chrome requires a cold start of the browser instance and includes DNS resolution times. That means that at this moment the measurements using this method will have an overhead of +/-600ms added to the real measurement time. The relative measured times between all destinations are correct since all of them are made with the same probe, but the absolute measured times include the above mentioned overhead.


Now let’s see what happens with the 100kB Page Load test in a selection* of worldwide countries.


World Pageload graph
The average measured times by country and CDN can be seen in the following table:
World Pageload table
We can clearly see that Google Cloud CDN outperforms all other CDNs in loading a whole page in most countries. We can have a look at the special case of Japan, which shows the lowest measured times, by simply filtering results in CloudPerf.
Screen Shot 2016-04-15 at 16.13.36


Going further, if we take a look at a selection of european countries**, we observe a similar situation only with Cloudfront, Level3 and Akamai coming a lot closer to Google’s performance.
PageLoad Europe

Now, in the USA the battle is fierce, although higher than Japan, the overall loading times of most CDNs are very close to each other and the general performance is really good, except for MaxCDN, which in our measurements got a little behind the rest, but still performing reasonably well in comparison to other regions. Nevertheless, it is evident that CDNs strive for top performance especially in the US market.
USA Pageload graph

How does Google achieve such top loading times practically everywhere? We think that this is precisely due to the fact that Google CDN is embedded in the Load Balancing system of Compute Engine and that means that you can configure your site to automatically replicate your VMs whenever it is necessary to a location closest to your users, meaning an overall higher response time and effectively shortening loading times.There is a very noticeable difference when we include into the equation the time it takes to load and resolve all objects of a page from a single location close to the user, as opposed to other CDNs where only traditionally cacheable content gets copied and the rest has to be retrieved from the origin.


PS: You can make your own comparisons and performance tests using CloudPerf.Sign up now!


* Australia, Brazil, France, Germany, India, Japan, Russia, Singapore, South Africa, Turkey, United Kingdom and United States

** France, Germany, Italy, Netherlands, Norway, Poland, Romania, Spain, Sweden and United Kingdom.

Surprise! Google CDN Alpha already outperforming competitors in Europe

Google-cloud-services

During the last couple of years, Google has been undergoing massive structural transformations: first they shut down their PageSpeed Service which was their own take into the CDN world until August this year. In exchange of that, they launched CDN Interconnect, a program where Google joined forces with other CDN providers like Cloudflare, Fastly, Level3, Highwinds and lastly Akamai, opening the doors to those partner CDNs to serve content originated from Google Cloud Platform and profiting from using the giant’s Backbone Network. On top of that, Google has been quite successful in building their impressive Global Cache for speeding up their own services by directly installing caches on ISPs. In a previous post we found out more than 800 cache locations worldwide.

The Alpha Release of Google Cloud CDN was interpreted by the press as competition with their own partners from CDN Interconnect. We looked closer and discussed our first impressions in our previous post. Now it’s time to look inside this new service and see what it has to offer. We looked at our results with skepticism at first, but after looking closer at them, we could recognize the gestation of what could be the new wunderkind among CDNs.


Since the current release state of Cloud CDN is Alpha, you can only use it by invitation. In our case, we requested access and it was granted only 2 days later.

Cloud CDN is built within Compute Engine, which is their Cloud Service for creating and running Virtual Machines (VMs). This service features elasticity options for responding to changing traffic conditions, such as replicated instances and Load Balancing. This is where Cloud CDN comes into play: as part of a load-balancing configuration.

According to its own documentation:

” Google Cloud CDN (Content Delivery Network) uses Google’s globally distributed edge caches to cache HTTP(S) Load Balanced content close to your users. Caching content at the edges of Google’s network provides faster delivery of content to your users while reducing the load on your servers.”

The charges for using this service are based on the pricing for Load Balancing and Protocol Forwarding. On top of the hourly charges for using the first 5 Forwarding Rules of $0.025/hour, the cost per processed GB is $0.008/GB. On top of these costs, consider the standard Internet Egress rates you have to pay for delivering your content, which ranges from $0.08/GB to $0.23/GB depending on the region and monthly usage. Heavier users profit from cheaper rates. Neverhteless, this is not a particularly cheap solution, as we can find more affordable CDNs, you can take a look at this comparison.

If you already have a backend service running in a VM in Compute Engine, activating Cloud CDN after registration requires only one command. In case you don’t have a load-balanced backend service running you can take a look at our quick tutorial for setting it up. This will spare you some time of reading through many different pages of documentation.

We ran 48 hours of continuous performance monitoring using our tool Cloudperf, with a total of 33600 single last-mile measurements for each test. We can see that in terms of throughput, Google CDN doesn’t perform especially well in comparison with other CDNs.

Throughput
Throughput Table
But if we look at our measurements in Europe… Surprise! Amazingly low latencies!

Latency EU - GraphLatency EU - Table
Our Thoughput measurments confirm that the young Cloud CDN is already giving top performance in Europe! This is a very clear sign on where Cloud CDN shows competitive advantages, should you decide to use it on its current state. If you’re interested in speeding up your services in Europe, this CDN is already a viable solution.

On the other hand, in the US we could observe a notoriously high latency and not very fast download speeds.

Latency US by ISP - Graph
These results may surprise us at first, but we have to remember that this CDN service is still in Alpha stage, which means that it can still be radically altered during its development. According to the current documentation (December 2015), content is cached only in a small subset of POPs during this stage; the full POP usage will be available later on. Also the cacheable file size is currently limited to 4MB. Caching larger files will have to wait for a further release.


In the next table we can compare the latencies achieved in the US on different ISPs.

Latency US by ISP - Table
In other countries the latency tests didn’t show much better results except for european countries, where it performed notably well.

Latency G20 - GraphLatency G20 - Table

From the current state of development, we have observed that Google Cloud CDN isn’t going full speed yet. It is evident that it’s in fact an Alpha release. Nevertheless, looking at their performance in Europe, we can definitely see its immediate utility in multi-CDN scenarios, where customers demanding fine tuned performance can use Google CDN in Europe while using different CDNs in other regions.

How does this fit between CDN Interconnect and Global Cache? Technically speaking, we can see that Cloud CDN is built upon the Load Balancing system for their Cloud Backend Services. With that in mind, we can consider this a hand-cut CDN solution designed especially for Google’s own cloud services. On the other hand, Global Cache accelerates mainstream Google services at an ISP level, while CDN Interconnect allows partner third party CDNs to cache and serve content stored in Google Servers much faster.

All this helps us visualize an impressive caching infrastructure Google is extending to keep his place in today’s and tomorrow’s very competitive Internet. Even in an Alpha release which reasonably showed mediocre results for the most part, we know this is to be expected and should radically change after its final release. Of course Google knows this…after all, being and staying an Internet giant isn’t easy!


PS: You can make your own comparisons and performance tests using CloudPerf. Sign up now!

Is Google taking on Akamai? …not really.

The past 9th of December Venturebeat published a rather controversial article stating that Google is quietly launching its own CDN to compete against Akamai. News spread fast, and now Google’s move is in everybody’s lips. Is this an unexpected low punch from Google’s side? If we take a closer look, we may find that appearances can be deceiving.

The internet keeps growing and reaching more people every year. With an estimated number of 3.4 Billion users, the network has covered 46.1% of the worlds population (source). Big players in today’s Net are rearranging their lines to confront this fierce battle that comes with delivering content to such a massive number of users. We already talked about Google’s Interconnect program, where strategic partnerships with CDN providers like Highwinds, Level 3, CloudFlare and Fastly were made to allow them to serve content stored in Google’s datacenters using the giant’s backbone network. We also talked about the very extended Google Global Cache in our last post, with more than 800 cache instances putting their popular contents and services closest to consumers.


Now Google has announced another take of their own in the world of CDNs with the Alpha Release of Google Cloud CDN. Adding to their network 70 globally distributed Edge Points of Presence, which will cache Google’s content for partnered network operators.


On the other side of the coin, we have Akamai claiming to be the world’s biggest CDN. Their own philosophy and network design is radically different from Google’s: Akamai’s backbone is the Internet itself. Akamai’s strategy is to distribute and operate isolated cache instances everywhere they can. Caches aren’t even connected between themselves in any particular way, in other words, no special “backbone”…achieving impressive results and an excellent reputation, this giant has reached a virtually ubiquitous worldwide coverage: 130000+ servers, 2200 POPs covering 1200 Networks in more than 800 locations in 81 countries.

POPs Locations Countries
Akamai 2200+ 800+ 81+
Google Global Cache ? 800+ 100+
Google CDN 70 51 33

Looking at this picture, imagining Akamai and Google clashing against each other in the battle of the clouds may seem like a likely scenario for many, but this is far from becoming reality. It is true that both are immersed in the same business, but their focus is completely different. While anyone can go directly to Akamai and get their CDN services, Google doesn’t offer the Global Cache infrastructure directly to third parties, in fact, until now Google’s focus has been facilitating the delivery of their own content, whether from their own platforms like Youtube or any other content hosted in their datacenters. Since their content is so massively popular, ISPs are naturally interested in serving them as fast as possible, so Google was able to construct a massive network of caches directly installing them within the ISPs probably at no cost, profiting from a win-win situation.

Seen under this light, we think it is unlikely that ISPs would allow Google to use their Global Cache without taking a proper share of that pie.

So all this confusion about Google and Akamai battling in the clouds seems to be a bit exaggerated. In fact, Akamai is also recently participating on the Google Interconnect Platform, which will also allow customers to save up to 66 percent on Google Cloud Platform egress costs.


“As more and more enterprises come to rely on cloud-based computing and storage resources to drive their businesses, it’s critically important that performance is maximized and cost effectiveness is maintained,”
explained Bill Wheaton, executive vice president and general manager, Media Products Division, Akamai. “As the operator of the world’s largest distributed CDN platform, we’re collaborating with Google Cloud Platform to ensure that our joint customers can pass traffic directly from Google Cloud Platform to the Akamai CDN, empowering them to take full advantage of their cloud investments.”
(source: PR Newswire)


The real battle of the clouds is being fought against Amazon and Microsoft, where Google is actually lining up with key players in the world of CDNs and not getting in their way. Trying to own everything is not necessarily the best strategy.

Demystifying Google Global Cache


The amount of data Google serves through the Internet is undoubtedly enormous and their network is correspondingly efficient in doing so. One key component of Google’s information superhighway is their CDN-Like Cache infrastructure: the Google Global Cache. We ran some tests with ProbeAPI and had a closer look at this vast network, which enables us to enjoy Youtube at the best quality our ISP’s capacities allow.

Our experiment showed us the extent of the deployed network in its worldwide coverage. We were able to observe the impressive number of 2383 Cache Instances across 800 locations all around the globe. It is important to take into account, that there may be more locations where a particular ISP wasn’t available through any probe when we ran the experiment or, for example, we have no probes in an ISP which runs through a particular Cache Server, especially in remote locations where the presence of ProbeAPI Probes is still scarce.

We used all the available probes at the moment we ran the experiment, delivering a total of 240184 individual results, which were grouped and cross-linked to obtain relevant data.

The cache locations are codenamed with three letter airport-codes. Cross-linking the Airport codes from the IATA with the codes obtained from the Cache-Servers’ names, we were able to obtain their approximate geographical location.

Continent

Detected Cache Instances

Asia

740

Europe

620

North America

487

South America

347

Africa

103

Oceania

81

Central America

5


The top 20 Countries with the highest number of detected Cache Locations are:

 Continent

Country

Detected Cache Instances

North America United States 296
Asia Russia 263
South America Brazil 220
Asia India 83
North America Canada 76
North America Mexico 70
Europe United Kingdom 67
Asia Japan 63
Europe Ukraine 59
Asia Thailand 51
Oceania Australia 48
Europe Poland 45
Asia Indonesia 38
Europe Germany 36
South America Argentina 31
Oceania New Zealand 27
Europe Spain 27
Europe Italy 27
Europe France 26
Asia Bangladesh 24


Top 25 Cities with the most Cache Locations detected:

City Country Detected Cache Instances Detected Networks Ratio Networks/Caches
Moscow Russia 42 918 21,9
Sao Paulo Brazil 31 740 23,9
Tokyo Japan 31 116 3,7
Rio De Janeiro Brazil 28 322 11,5
Kiev Ukraine 28 277 9,9
London United Kingdom 24 347 14,5
Dhaka Bangladesh 22 51 2,3
Bangkok Thailand 21 28 1,3
St. Petersburg Russia 18 102 5,7
Sofia Bulgaria 17 104 6,1
Yekaterinburg Russia 17 84 4,9
Buenos Aires Argentina 17 79 4,6
Jakarta Indonesia 17 28 1,6
Bucharest Romania 15 92 6,1
Belgrade Serbia 15 42 2,8
Budapest Hungary 14 123 8,8
Sydney Australia 14 54 3,9
Mumbai India 14 46 3,3
Montreal Canada 14 43 3,1
Auckland New Zealand 14 39 2,8
Warsaw Poland 13 318 24,5
New York United States 13 276 21,2
Novosibirsk Russia 13 76 5,8
Toronto Canada 13 71 5,5
Kuala Lumpur Malaysia 13 28 2,2

To give ourselves an idea of the number of users covered by our detected servers, we have ranked the 25 top countries in terms of the estimated number of users.

Country Detected Cache Instances est. Number of Users Users/Cache
India 83 236.000.000 2.845.000
United States 296 219.000.000 741.000
Brazil 220 105.000.000 478.000
Japan 63 93.000.000 1.478.000
Russian Federation 263 78.000.000 298.000
Indonesia 38 66.000.000 1.733.000
Germany 36 66.000.000 1.826.000
Nigeria 8 61.000.000 7.666.000
Mexico 70 61.000.000 870.000
France 26 52.000.000 2.000.000
United Kingdom 67 51.000.000 764.000
Egypt 13 45.000.000 3.455.000
Philippines 11 41.000.000 3.715.000
Vietnam 16 40.000.000 2.496.000
Turkey 1 35.000.000 35.212.000
Spain 27 34.000.000 1.271.000
Italy 27 34.000.000 1.268.000
Bangladesh 24 32.000.000 1.321.000
Colombia 22 30.000.000 1.375.000
Argentina 31 30.000.000 976.000
Pakistan 3 27.000.000 9.147.000
South Africa 14 23.000.000 1.642.000
Poland 45 22.000.000 500.000
Kenya 6 21.000.000 3.517.000

* Thanks to APNIC for helping us estimate the number of users in each network.

The following map pinpoints all the instances of Google Global Cache we could observe. Please remember that the pins are pointing to the cities’ airports and not their precise location within the city, which is close enough for describing their location for these purposes.

From the huge number of Probes we applied for the experiment, we got an impressive array of the variety of networks connected to each Cache Location.

When clicking on the pins, we can see a list of cache instances and below the corresponding list of connected networks to each cache.

Top 25 Cities with the most networks detected:

City Country Cache Instances Detected Networks Ratio Networks/Caches
Moscow Russia 42 918 21,9
Sao Paulo Brazil 31 740 23,9
Chicago United States 11 511 46,5
Frankfurt Germany 7 475 67,9
Washington United States 10 470 47,0
Paris France 12 405 33,8
Amsterdam Netherlands 8 383 47,9
Dallas-Fort Worth United States 9 356 39,6
London United Kingdom 24 347 14,5
Rio De Janeiro Brazil 28 322 11,5
Warsaw Poland 13 318 24,5
Prague Czech Republic 10 288 28,8
Kiev Ukraine 28 277 9,9
New York United States 13 276 21,2
Los Angeles United States 11 262 23,8
Miami United States 6 236 39,3
Atlanta United States 7 177 25,3
San Jose United States 3 159 53,0
Milan Italy 4 158 39,5
Katowice Poland 4 145 36,3
Belo Horizonte Brazil 12 131 10,9
Madrid Spain 9 125 13,9
Budapest Hungary 14 123 8,8
Tokyo Japan 31 116 3,7
Mountain View United States 2 109 54,5

We can observe, that there are locations with a high number of access points and also a high number of networks, but like in the case of Moscow or São Paulo, the relationship between the number of networks vs. number of access points is very high. A notable case is Tokyo, where 116 ISPs for 31 Cache Access Points were observed, giving a ratio of only 3,7.

It has to be taken into account that many access points are dedicated to different segments, for example, if we look at Berlin, Germany we will see that Vodafone and Telefonica Germany have their own dedicated access points (vodafone-ber1 and hansenet-ber2). On the other side, ber01s12 is probably owned by Deutsche Telekom AG, the biggest Telecom in Germany, which is giving access to other companies through their infrastructure, so we can see Verizon, Kabel Deutschland and also some other Telefonica users go through this other Access Point. Finally, if we observe ecix-ber1 we can see that that point seems to be reserved for Private Business ISPs, like e.discom, WEMACOM, the multimedia specialist MyWire or the private IT Infrastructure provider Macnetix.

Another important fact that has influence on the number of detected networks is our own coverage with ProbeAPI. In cases like Moscow, ProbeAPI has a high number of active probes in Russia, with Moscow having the highest concentration of them. That’s why this data has to be considered a snapshot of Google’s CDN taken with all our available probes at one particular time.

Following the same line, an interesting case is Turkey, where we could detect only one Cache Location, despite of having typically a high concentration of active Probes there. Turkey has been blocking access to Youtube and other Google services intermittently during the last years following political controversies, which could explain the low number of results obtained from a well covered region.

Conclusion

There is much mystery surrounding Google Global Cache which is one of Google’s most important pieces of infrastructure. We were able to gather an impressive number of information with one single measurement of ProbeAPI, which helped us to understand the extent and distribution of Google’s Cache Locations.

Taking into account that this information was made snapshot-like with one sole measurement, we gathered 2383 Cache Instances across 800 locations worldwide (at least) that Google is actively using throughout their partner network operators.

There are still some issues to be covered by more measurements over time which will surely reveal more networks and cache locations. This is one case where continuous monitoring will offer a good opportunity to get thorough measurements, not only in terms of traffic variability, but also in terms of coverage, as probes connect to ProbeAPI through different locations during any period of time.

Fill out my online form.


Quality of Service: Lessons from Content Delivery World Conference 2015

content_deliveryQuality of Service: Lessons from Content Delivery World Conference 2015

CDW 2015: The evolution of content delivery architectures and workflows, and their role in distributing content throughout the globe.

In October 2015 Speedchecker hosted a stand at the Content Delivery World Conference 2015. Featuring  influential speakers from Canal+, Time Warner Cable, Wuaki.tv, Sky, Telecom Italia, BT, Telefonica, Cisco, Freeview and others.

This is a summary of the event from Steve Gledhill (Head of Content, Speedchecker Ltd) with focus on how to improve the Quality of Service for the end user.

SAMSUNG CSC
Typical activity between presentations

The Agenda

Content Delivery World 2015 brought together players from across the content delivery ecosystem, enabling the exchange of ideas and innovations and formation of partnerships that will fuel the growth of the content delivery industry, furthering the potential of this multi-billion dollar market.

SAMSUNG CSC
Standing room only

Of particular interest was how to measure the Quality of Experience for the end user rather than only the Quality of Service of the suppliers (CDNs, ISPs and Media Providers). Most of the information that we see regarding the performance of Content Delivery focus on latency, bitrate, throughput and other important factors that relate to the efficient data transmission. We were keen to learn from the key players at the conference how they translate these cold figures into a meaningful Quality of Experience. It was heartening to see that QoE was covered in most of the presentations indicating that this is seen as a key factor in improving the industry moving forward.

Measuring Quality of Experience

During a discussion about the need for multi-CDNs (redundancy, control, independence, QoE, peak traffic management) a number of Key Performance Indicators were listed:

  • Availability
  • Throughput
  • Buffer status
  • Routes taken
  • Bandwidth
  • Latency
  • User experience
  • Video impairments
  • Packet loss
  • Concurrent users
  • User viewing patterns

With regards to QoE it was agreed that “quick enough is good enough”; black screens are unacceptable; less than 2 seconds to switch channels is OK.

VTT in Finland have used user panels to discover how much (or how little) latency and buffering will cause their viewers’ QoE to become unacceptable.

Delivering Quality of Experience

Time Warner reported that they have seen a steady 20% annual increase in the growth of IP traffic year on year and they note that 78% of this is video. In order to cope with this steady increase they see a need for TCP Tuning, OS Tuning, NIC Tuning and a general reduction in the protocol overheads. They see the key metrics need to be captured passively and actively and include the monitoring of the system, analysis of logs and simulated clients.

Alcatel made the point that the CDNs need to be more content aware than they are at the present to ensure the highest quality. They also recommend that each CDN end point should be aware of existing cache to prevent unnecessary delays.

Another common discussion was around variable bit rate. For example, Sky Italia use Adaptive Encoding to ensure that users with 2.4 Mbps experience the same quality as those with 9 Mbs using near real-time encoding. This relies on a high quality original input. This bit rate is managed by the Sky CDN Selector at the Edge Server as close as possible to the consumer.

Orange presented some interesting concerns around certain protocols. Their international CDN provides average speeds of 4Mbps but they feel they have a number of issues to contend with. First, they have issues with caching (many presenters referred to caching as being a key area for improvement). Second, they highlighted the HTTPS issues for carriers under HTTP 2.0. Third, the need to be flexible and responsive to changes makes it hard to provide consistently high quality. Finally, they made reference to the Microsoft Smooth Streaming minimum latency requirement being too high to provide live content as they would wish to.

Multicasting

Looking to the future and how to deal with increased demand and higher quality video BT TV talked about Multicasting. They acknowledge that although they can distribute at speeds up to 12GBs at production that they lose control the closer they get to the customer. They have no control over the Home User’s devices or network; their equipment; the wiring in the home or the core/backhaul network all of which can lead to packet loss. Multitasking reduces the number of individual streams required and thus reduces delays and congestion. They can use the application layer to control dropped packets / retransmission and can even use 2 identical streams via different routes to be combined at the receiver in the home thus providing built-in redundancy. Problems are identified by end to end monitoring of the network data and user behaviour. The break-even point for multicasting compared to unicasting is 500 users or more. Quality of Experience is improved in terms of immediacy, quality and
continuity.

Problems with multicasting: Requires Unicast Tunnelling across Gaps where Multicast is not possible; Speeds can fall to slowest bit rate; Unicasting is recommended in the home/office.

Delivering on Mobile

Aventeq predict that by 2020 the average smartphone contract will allow 5Gb of data to be downloaded each month. This confirms that we need to ensure that the user experience for the mobile user is given high priority when considering QoE.

This emphasis was highlighted by EE when they showcased their 4G video offering showing seamless streaming from dense urban areas, to high speed (legal) motorway driving and in to the countryside and forests of England. They say this is possible because of the UK having an average speed over LTE of 20Mbps – the fastest in the World.

EE also took a different approach to improving QoE by not just dealing with latency and speed but with the actual content. They propose giving audiences to live events the option to see a choice of angles and bespoke statistics. This is available in the home but they propose making this available on mobile devices.

CDNs – Content Delivery Networks

CDNs are the backbone of the delivery mechanism and were a common point of discussion and debate throughout the conference

A number of Media providers are using or developing their own CDN (Content Delivery Network) to ensure that they are in control of the users’ QoE. Canal+ in France have 20-25 Free To Air channels and other services that will be transmitted via their own CDN in the next 12 months. Most of their traffic is driven by Live (premium) content and it is important for Canal+ that they maintain a high QoS for this content. They report that their users complain about streaming that doesn’t launch; video quality issues and buffering in roughly equal measure. Their research shows that download speeds of between 2 and 2.5Mbps are acceptable for the QoE of the end user. These speeds are achieved at all times except for the peak times of 7pm and later when problems start. Canal+ plan to provide their content directly to the ISPs instead of using a CDN as is currently the case. This should save money but they also hope that it will improve users’ QoE.

This lead to recommendations for choosing CDNs:

  • Point of Contact if there’s a problem
  • Excellent throughput and latency performance
  • Live content handling
  • Cloud computing support

Net Neutrality, Copyright and DRM

Most of the discussions and presentations dealt with moving the data around as efficiently as possible with no concern with regard to Net Neutrality. That’s not to say that this is ignored but rather, I suggest, that it is acknowledged that best technical practice needs to be modified to comply with regulations in any and all countries. For that matter, DRM and other copyright issues were only touched upon in a few presentations for similar reasons: the focus of the conference was on efficiency and how the technology can be used and improved upon.

Towards an LMAP Specification of ProbeAPI.

In an effort to bring ProbeAPI nearer to the internet measurement community, we’ve been paying close attention to the new LMAP specification for internet measurement platforms. LMAP is being defined with the goal of standardizing large scale measurement systems, in order to be able to perform consequent measurements among diverse entities. They may even differ in implementation details, but complying to this standard opens the possibility of making the components, results and instructions comparable.

“Amongst other things, standardisation enables meaningful comparisons of measurements made of the same Metric at different times and places, and provides the operator of a Measurement System with criteria for evaluation of the different solutions that can be used for various purposes including buying decisions (such as       buying the various components from different vendors). Today’s systems are proprietary in some or all of these aspects. “ – RFC 7594, July 2015

In order to find out how compliant or non-compliant ProbeAPI might be toward this standard, we started a design and implementation comparison in terms of an LMAP system. In this post we will focus on the general outline of the system, oriented to its main components, their roles and data flow. A detailed comparison for a data model and measurement methods will have to remain pendant for a dedicated post, since they are very extended topics.

The general working scheme of ProbeAPI includes most components from the LMAP specification in very similar roles:

The user with the API makes a measurement request. The API, hosted in the cloud, then communicates the testing instructions to the Controller Interface, which will forward the testing instructions to the Bootstrapper and Controller outside the cloud. The Bootstrapper part is in charge of integrating the probes to the whole system and updates the database to keep track of the disconnecting probes. It is implemented using an XMPP server, which uses a sleek protocol and allows for all the probes relevant to a particular measurement to receive the message simultaneously.

The probes themselves report their online status directly to the API, while the Bootstrapper keeps track of the ones that disconnect. The probes receive the measurement instructions from the Controller. After carrying them out, they will send the results directly to the API to be delivered to the user.

LMAP Scheme for ProbeAPIThe Controller and Bootstrapper component mixes the Controller part, which is an element inside the scope of LMAP while the Bootstrapper lies outside the LMAP scope.


When a new probe becomes online, it generates its own unique ID which will be sent together with the results, where they can be separated in terms not only of ProbeID, but also ASN or Country. Then it calls the login method from the cloud interface so it will be accounted as online. When a Probe logs off, it is the Bootstrapper service which accounts their disconnection to the Database.

Interaction Diagram for MA-Login, Measurement Instruction and MA-Logout.

When a measurement instruction is sent, the Control Protocol is an XMPP instruction which can contain, for example, the following information:

  • <Task-ID>Task-ID
  • <MA-ID>Probe-ID
  • <suppression>TimeOut
  • <instruction>Command
  • <parameter> host_address
  • <parameter> ttl
  • <parameter>count
  • <parameter>timeout
  • <parameter>sleep
  • <parameter>BufferSize
  • <parameter>fragment
  • <parameter>resolve
  • <parameter>ipv6only

There is a Task-ID generated from the API, which is passed over to the probe with each measurement. When the results are collected, they are easily recognized.  Failure information from the Measurement Agents will be included in the results.

Here is an example of the results header obtained for httpget measurements:

  • HTTPGet_Status
  • HTTPGet_Destination
  • HTTPGet_TimeToFirstByte
  • HTTPGet_TotalTime
  • HTTPGet_ContentLength
  • HTTPGet_DownloadedBytes
  • Network_NetworkName
  • Network_LogoURL
  • Network_CountryCode
  • Network_NetworkID
  • DateTimeStamp
  • Country_Flag<url>
  • Country_Name
  • Country_State
  • Country_StateCode
  • Country_CountryCode
  • Probe-ID
  • ASN_Name
  • ASN_ID
  • Location_Latitude
  • Location_Longitude

The possible measurements at the time are:

ICMP (ms) , HTTP-GET (ms), Page-Loading time (ms), DNS Query Time.

The API itself doesn’t offer scheduling functions yet, but they are being implemented. Since ProbeAPI’s measurements are active. Each MA measures normally one flow per instruction. The report Data can be presented Raw or formatted in Json. There are also plans to implement scheduling also for reports. Right now reports are immediate.

There is also no Subscriber Parameter DB, since this information is delivered directly with the results from the probes. AS-Number, Country, AS-Name and Geographic Location are provided directly with the results.

A study on the coverage of ProbeAPI and RIPE Atlas

Ripe Atlas has been successful in establishing a fairly well extended network of measurement Probes. They are placed in different environments, which can be server rooms, volunteers ‘offices, universities and households. Since the placement of a probe requires a physical device to be installed, the deployment and growth rate of the network is limited to the available physical distribution capacities and the cost of producing enough physical devices. On the flip side, this quality of being a hardware based measuring platform, not only guarantees a stable availability of the probes, but also there is a genuine piece of hardware that allows any customizations the measurements may require.

Top 20 Atlas by Users

Although Atlas has already achieved an impressive number of deployed probes, there are still large networks in need of coverage.

ASN Country(ISO 2 letter code) Users(APNIC Labs estimate) RIPE Atlas probes(online)
AS4134 CN 336 million 2
AS4837 CN 204 million 0
AS9829 IN 66 million 0
AS7922 US 55 million 336
AS17974 ID 47 million 1
AS8151 MX 39 million 4
AS24560 IN 33 million 5
AS8452 EG 33 million 0
AS4713 JP 30 million 8
AS7018 US 29 million 40
AS9121 TR 27 million 8
AS3320 DE 26 million 206
AS28573 BR 24 million 20
AS45595 PK 23 million 1
AS9299 PH 22 million 5
AS9808 CN 21 million 0
AS701 US 20 million 80
AS45899 VN 19 million 1
AS18881 BR 19 million 8
AS4766 KR 18 million 8

In this respect ProbeAPI can provide much relief. Because of its software-based nature, it has many complementary features that provide very interesting strategic flexibilities. For example, its deployment has a very low cost: it only requires the installation of a piece of software on a Windows computer. Being able to measure real user’s connectivity is a big advantage, but at the same time the normal usage of computers make ProbeAPI instances very volatile: personal computers go on and offline for different reasons during their normal usage.

We can note by observing both graphs, that there are still large networks with little coverage from ProbeAPI. ASNs 4134 (China Telecom), 4837 (China-168) and 9829 (India Telecom) are good examples of large networks with a comparatively small number of probes.

Nevertheless, ProbeAPI’s easy deployment gives us the possibility to be present in networks where too little or no physical probes have been installed.In our measurements, the number of available probes in ProbeAPI at a given moment is around 84000. During a normal usage day, more than 290000 became online. Although not all probes are online all the time, the number of available probes at a given moment is almost 8 times RIPE Atlas’ active probe count. This counterweighs the volatility problem of ProbeAPI’s instances, but for longer measurements from a static set of probes, the stability of Atlas Probes is an important fact to take into account.

It is important to remark that this comparison does not intend to establish technical superiority of one system or the other. Quite at the contrary, during this analysis we realized that in this respect, Atlas and ProbeAPI may contribute complementary features for measuring networks. For low-coverage, physically or politically hard to reach networks, a software solution like ProbeAPI may be a viable alternative in order to be able to first expand our general measurement coverage. Once a region starts installing more Atlas probes, longer measurements with fixed sets of probes become available thanks to Atlas’ more stable probes.

In this stage ProbeAPI’s end-user perspective can provide the convenient point of view of the last mile’s conditions. Combining the stability and precision of Atlas’ probes, with the massive amounts of possible measurements from end-user perspective, we can get a very well detailed portrait of the network’s condition.

Currently there are around 74000 active probes from ProbeAPI and Atlas monitoring the same ASs. ProbeAPI has around 14000 probes measuring networks where Atlas isn’t present. On the other side, Atlas has around 1700 probes where ProbeAPI is absent. Combined they give a grand total of around 95000 active probes able to measure networks serving almost 2.9 Billion users.

 Conclusion

The software-based design of ProbeAPI helps us achieve a vast coverage, even achieving the impressive number of 4000+ available probes for a single AS. Of course, the natural instability of the probes is an inherent constraint of ProbeAPI’s architecture, but that is the trade-off in exchange for a very extended and fast growing measurement network.

On the other hand, RIPE Atlas is designed around physical devices installed in diverse locations by hosts. This physical design brings the inherent stability a physically independent device can provide. Probes can be placed strategically in different points of the net other than only end-users, where measurements can reveal valuable information about the net’s conditions. All This requires some host recruiting, so this distribution process is naturally slower than a software one.
There are essential architectural differences between ProbeAPI and RIPE Atlas. Both systems were designed with a similar set of measurement features in mind, but their differences in design end up opening different doors, which in return give us the possibility of observing the net from a large number of diverse vantage points.

Testing Google Cloud Platform CDN Interconnect with CloudFlare on ProbeAPI

As many of you might have already heard, Google has introduced a new cooperation program with four CDN providers: CloudFlare, Fastly, Highwinds and Level3. The Google Cloud Platform CDN Interconnect Program consists on giving CDN providers access to route their traffic through Google’s private high-speed links, so they can serve their customers through reliable, low-latency routes thanks to Google’s infrastructure.

After reading the news, the ProbeAPI team got curious to find out how much of a performance gain is there to expect using this service, if any at all. Taking advantage of the large number of probes available at ProbeAPI, we set up an experiment to put this interesting new infrastructure to the test.

We used Amazon’s S3 and Google Storage as cloud storage providers and CloudFlare as CDN. To test similar routes, we chose the server in Singapore for our Amazon S3 bucket and the Asia server for the Google Storage bucket. We chose a maximum of 100 Probes in the USA as destination for our transfer tests.

After connecting and configuring the buckets to make them accessible through the CDN, we put the files to be tested in the buckets: several randomly generated 1.1MB PDF files, since PDF is one of the file extensions cached by CDNs.

Our objective is to measure the transfer times of those files and find out how long does it take to the CDN to cache those files for each storage provider. That means: we want to compare the transfer times of a cached file vs an uncached file from each bucket. We take the difference of those transfer times and we get the time it takes the CDN to cache a file, based on the delay caused by the caching and assuming that a previously cached file will transfer faster.

We test two files per bucket, let’s call them A and B. We make a pre-test running a Http Get test from ProbeAPI calling only the A file from both buckets. Running this pre-test made file A get cached in the US Servers of CloudFlare. Now we are in condition to run the real test. So we ran an Http Get test using ProbeAPI with files A and B on both buckets. So this is what happens: We cached file A with the pre-test, because of this, file A is expected to transfer faster than file B, which will have to be transferrred from Asia to the US CDN servers like file A did on the first test. Because this takes a bit extra time to do, we can calculate the overhead caused by the caching.

Results

After just a few tests with ProbeAPI, the first thing that strikes you, is the amazing speedup in transferring files preloaded in the CDN cache, especially for Amazon servers. There was also a noticeable improvement in the uncached Amazon’s performance after the 5th Test. Either because of sudden changes in network conditions or some load balancing mechanism reduced the caching overhead enormously because of that route being used repeatedly by hundreds of probes across the US.

Now getting to the point. We can observe Amazon’s amazing speedup when the file is already cached, even surpassing uncached Google Storage performance after some tests, which is already fast by itself.

Google’s buckets performed well altogether and that’s where we can clearly see the power of this infrastructure. The overhead introduced by the caching process when using Google + CloudFlare is minimal compared to the one introduced from Amazon + CloudFlare. This is due to the evident performance upgrade brought by this new partnership with Google, with CloudFlare now being able to use Google’s infrastructure to transfer data from the Datacenter to the CDN in the blink of an eye.

Caching Overhead Asia to US

We decided to run the tests once more, using the same methodology but transferring files from US servers to probes located in the US as well. This is a very likely scenario, thus making this set of measurements very interesting.

CDN Comparison US to USHere we can observe the expected scenario again: Uncached files take longer to deliver than files already cached in the CDN. In this case the difference is (also expectedly) less dramatic, due to the US-US traffic routing. The uncached files take similar amounts of time to load, although there’s still a noticeable overhead improvement when measuring transfers from Google’s buckets.

Even with your content being available locally in the US itself, the benefits of this CDN-Google partnership are still evident and relevant.

Analysis and Conclusion

We are living exciting times, with the Internet becoming ever faster and adopting more sophisticated connectivity year after year. This is one example of how the Net is adopting optimized structures. Some years ago we wouldn’t have dreamed of having our content available practically locally everywhere in the world, that’s one for CDNs.

Now with this cooperation, not only that is possible, but also your newest and updated content gets much faster to its destination and this is where the major beneficiaries of Google’s Interconnect platform lie, whose content is constantly changing, updating, adding new files and want them to be rapidly distributed for a virtually seamless availability all over the world.

Even with your content travelling shorter distances, like our US-US test showed, the benefits of serving customers faster and more reliably are still very noticeable and could be critical in certain scenarios: e.g. during a flash crowd, when your content (or part of it) becomes highly popular overnight. This would be a critical situation where you want to serve everybody without decreasing the quality of your service. The best part is that it works automatically and such a scenario that haunted administrators in the past, is becoming less and less fearsome thanks to CDNs and now even updated content is able to reach its destination with a short overhead.