Here we will show you how to measure a website’s performance using CloudPerf, how to set-up a measurement task and how to choose the best measurement parameters to suit your needs as well as the use of alerts to keep an eye on your services 24/7.
It is important to remember, that CloudPerf measures using probes located in the last mile of the net. Measurements may differ greatly depending on where you are measuring from. CloudPerf allows you to take both global and local perspectives using last-mile measurements, right there well all your users are, all over the world.
First, make sure you have created an account at CloudPerf. You can request Free Trial Access by following this link.
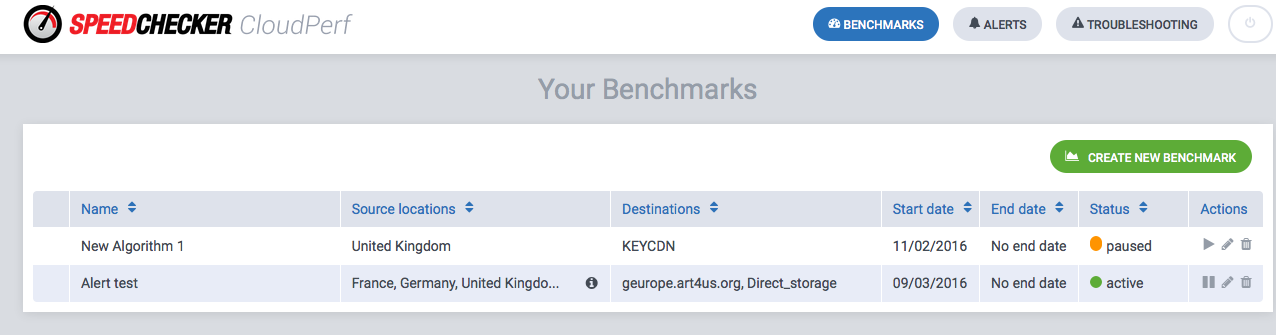
Benchmarks
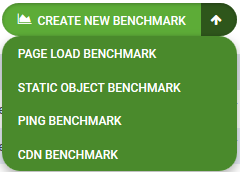
After logging in to CloudPerf, you will see the Dashboard screen. Move your mouse or click directly on “Create new Benchmark” to set up your new measurement. You can directly choose to measure a static object, Page Load, Ping or an automated CDN benchmark.
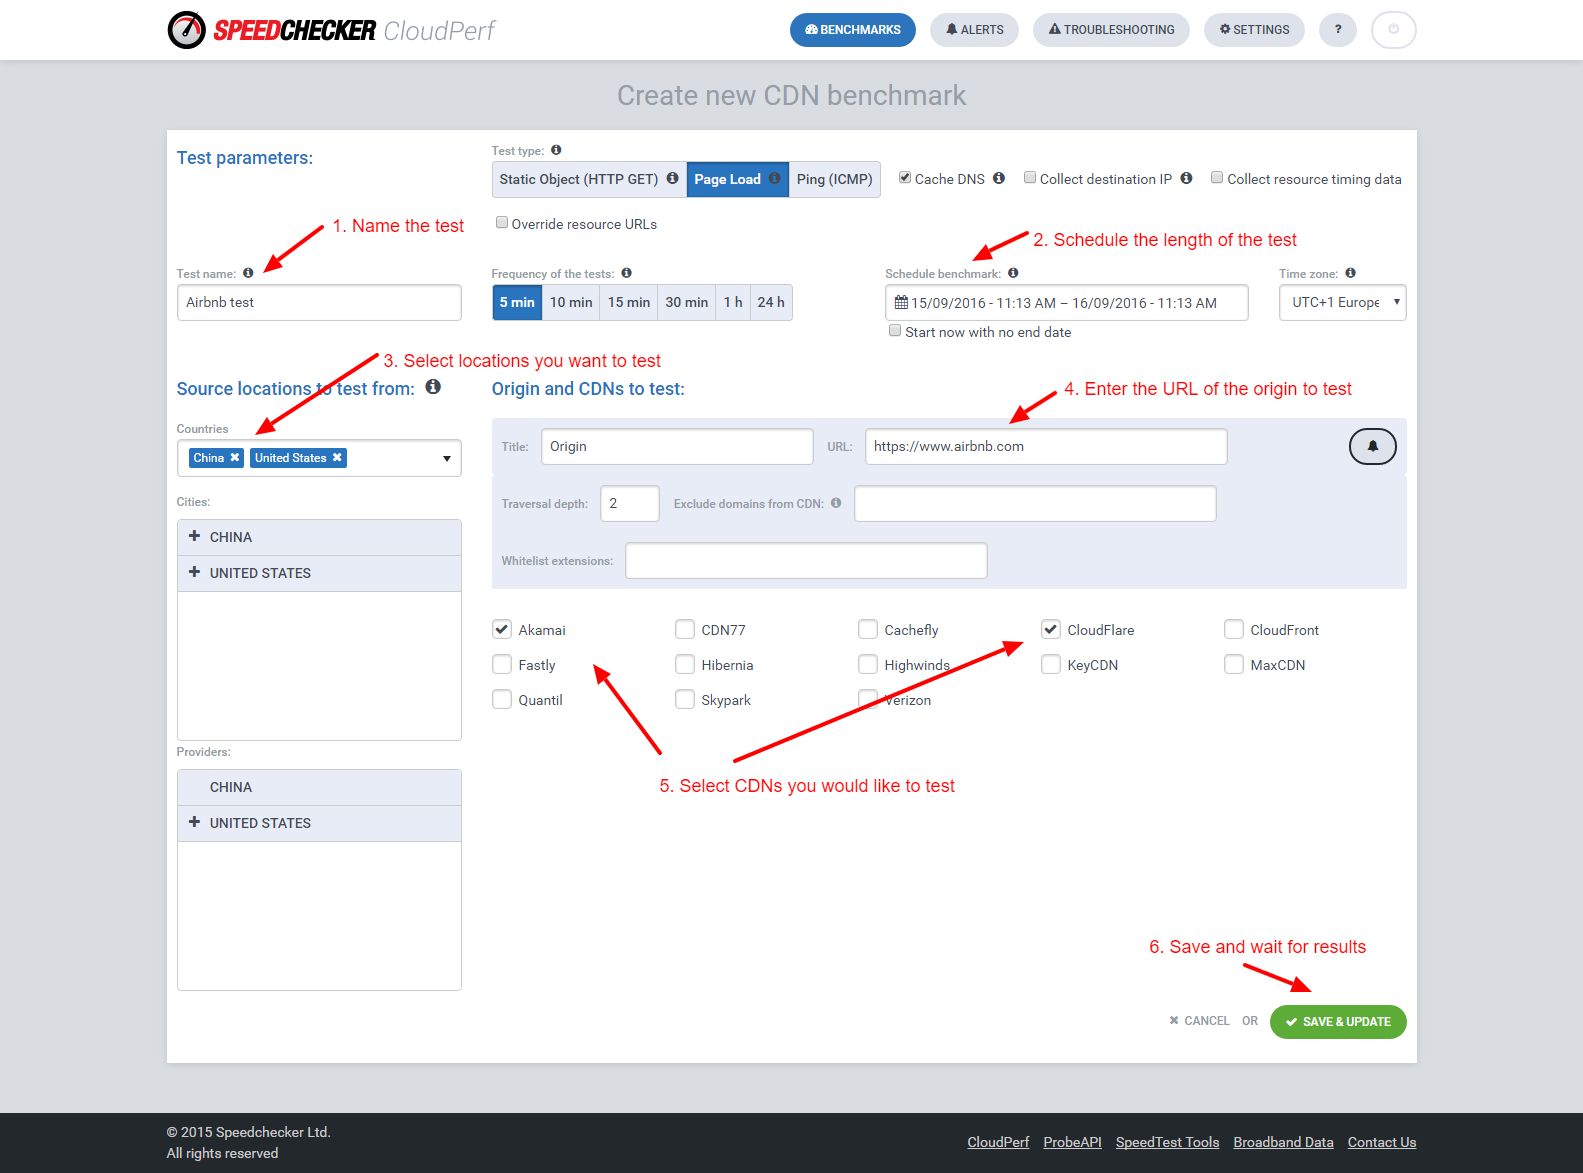
In the next screen you can choose the test parameters for your measurements.
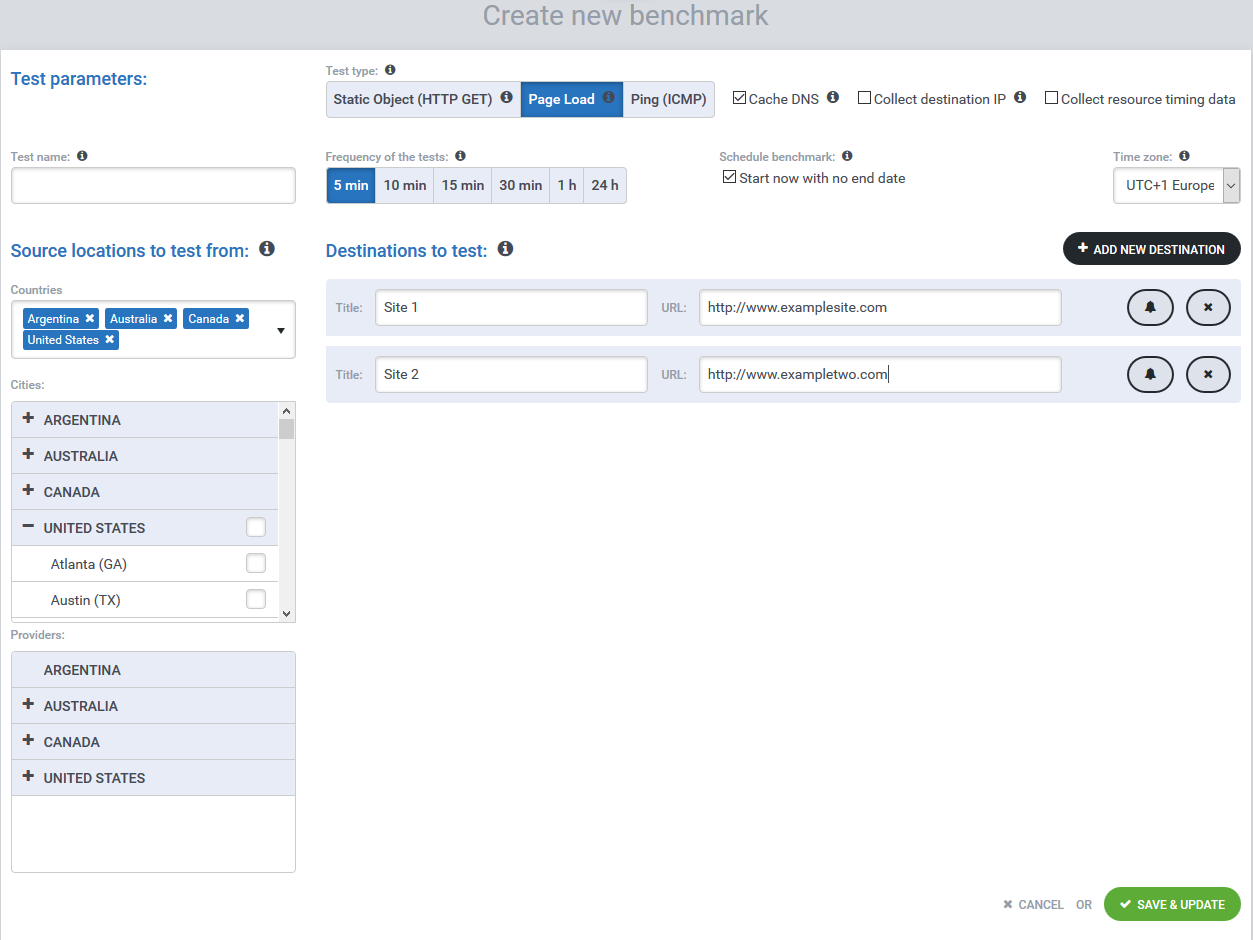
Test Type
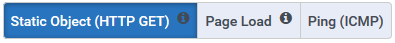
Static Object (HTTP GET)
Measures how long it takes to download a single object from your server to the measurement probes.
Page Load
Measures how long it takes to download a full webpage with a web browser. Cloudperf uses for this a real instance of Chromium, which downloads the page to its memory in the same manner as a normal user would experience in their own browser.
Ping (ICMP)
Use this button to set up a measurement using the ICMP protocol.
CDN
This measurement mode is only accesible through the green “Create New Benchmark” Drop-Down button from the Dashboard. This feature allows you to compare different CDNs we have preconfigured. Simply enter the source URL you want to test and select the CDNs of your interest with the checkboxes below. Cloudperf will copy your site from the source location and deploy them automatically on the selected CDNs and start measuring.
Cache DNS
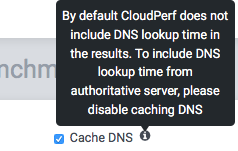
You can choose whether to include in the results the time it takes to resolve the DNS information from an authoritative server, rather than using the DNS cache. If you wish to include this data in the results, then disable this box.
Destination IP
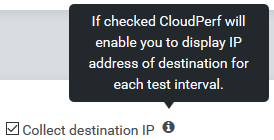
This checkbox will activate the collection of IP information from the destination. Use it if you expect DNS changes or redirections during your experiment.
Collect Resource Timing Data
When measuring with Page Load, activate this checkbox if you want to include in the results the time it took to load each element from the destination pages. Checking this box is required to be able to use the Waterfall Analysis feature.
Test Name
This label is for identifying your measurements in the dashboard.
Frequency of the tests
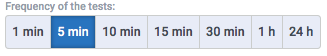
Especially depending on how long you want to measure your service, you can choose measurement intervals between 1’ (HTTP GET only) , 5’ , 10’ , 15’ , 30’ , 1h and 24h . For example, if you’re interested in diagnosing variations on your site’s loading time within 30 min up to 4 hours, then using an interval of 5’ or 10’ will provide enough data points to get a good idea on the variations during that time. On the other hand, if you intend to measure for longer periods of time, measuring every 30’ or 1h will be a most appropriate option. Measuring every 24h is most adequate for long term or permanent measurements.
Schedule benchmark
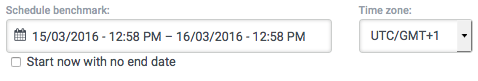
The default option here is to start measuring immediately with no scheduled end date. If you uncheck the box you will see a clickable box where you can enter the precise date and time where the benchmark should respectively start and stop.
Time zone
Use this to adjust the displayed time to the time zone of your interest.
Source locations to test from
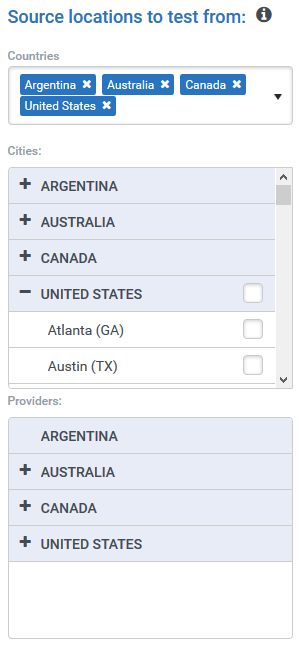
Click on this box and choose the countries you wish to run the test from.
For each country you can select from whih cities you want to run tests from, as well as being able to choose the ISPs of your interest, filtering out the ones you don’t want to include in your measurements.
Destinations to test
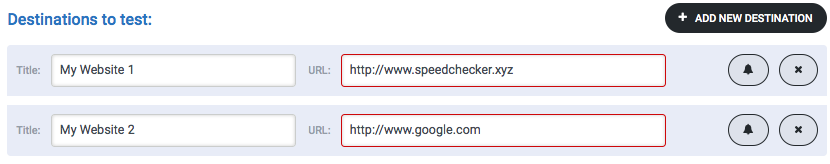
Here you can add the URLs you wish to test. They will be all tested from the same measurement points. Clicking on the Bell (you have to save the test first) will take you directly to the Alerts page to get notifications about performance issues.
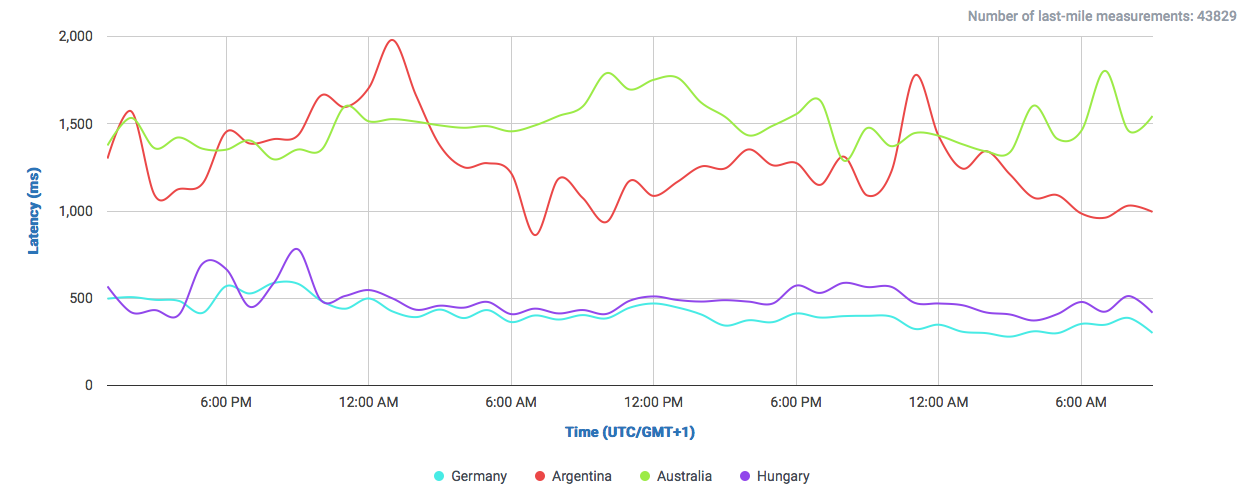
But now we have a working benchmark, measuring our websites continuously. Let’s have a look to the results page.
Benchmark Results
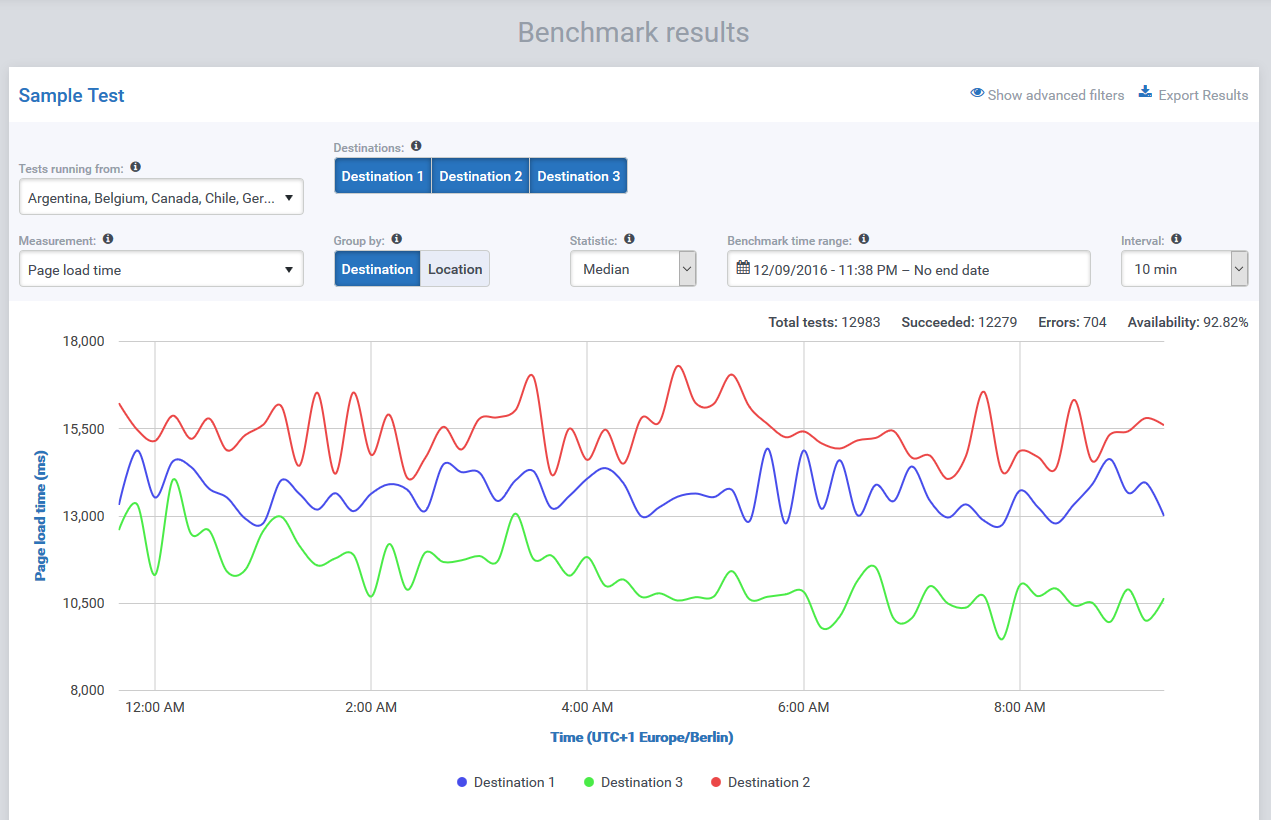
Tests running from
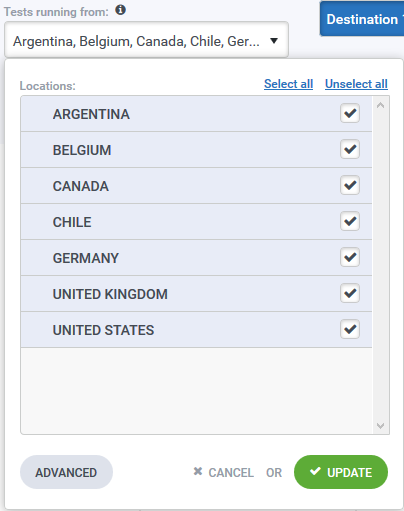
In the upper part, very much like when setting up the benchmark, we can select which countries we want to show in the results. This helps to filter and group our measurements for showing them in different perspectives. If you click the button labeled “Advanced”, you will switch to the Advanced View.
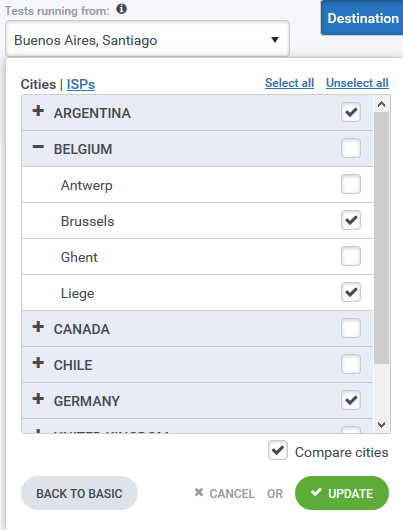
Here you will be able to filter your results not noly by Country, but also specifying Cities and ISPs.
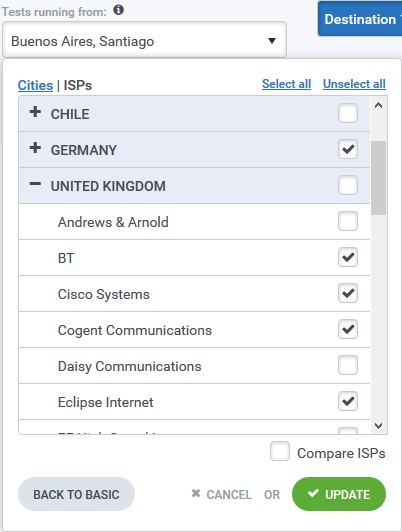
Checking the “Compare Cities” or “Compare ISPs” in the lower right part of this window will switch the results table under the chart from the standard comparison by Country to either by City or ISP, as selected.
Destinations
 Next, we have the Destinations buttons, which you can use to include or exclude each destination from your results.
Measurement
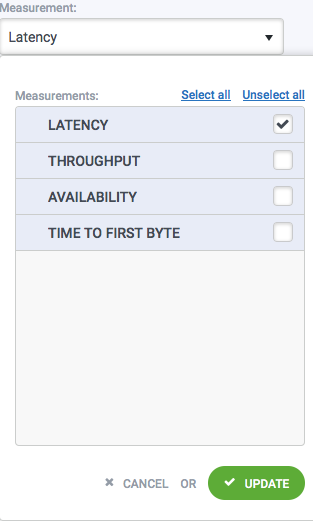
This menu lets you select what kind of measurement you want to display in the results. If you are measuring a static object using Http Get, you can select between Latency, Throughput, Availability and Time to First Byte. Latency is calculated from the total time of each measurement, while Time to First Byte refers literally to how long it took to receive the first byte from the server. Much like Ping but at Http level, which is more relevant for web applications.Throughput measures transfer rate. Availability measures the percentage of OK and ERROR messages received from each measurement.
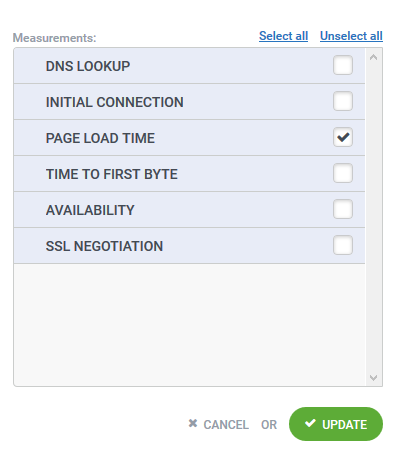 If you are using Page Load, the available options are DNS Lookup, Initial Connection, Page Load Time, Time to First Byte, Availability and SSL Negotiation.
Group By
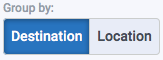
Use this to select which results the lines in the graph should represent. You can choose to show the lines by Location, that is, each line represents one country selected in the “Tests running from” section of this page, one line for all selected destinations in “Destinations”. On the other hand, choosing Destination will make the lines represent the measurements for each destination individually but combining all the selected countries in “Tests running from”.
Statistic
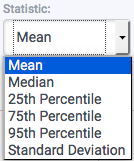
This changes the statistic descriptor representing the measurements. You can choose between Mean, Standard Deviation, Median, 25th, 75th and 95th percentiles. While the Mean and Std.Dev. combined tend to be a natural choice by intuition, we recommend to take into account a more complete picture of the statistical distribution of network measurements. Using percentiles, (median = 50th perc.) we can have a look on how the network looks by groups of users on very different network conditions, where some events may hit a big number of users with slower connections for example.
Benchmark time range
Use this box to select the time range displayed in the graph.
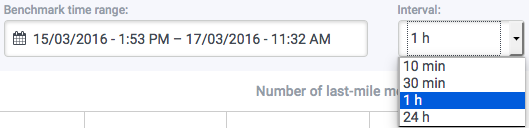
Interval
This sets the granularity of the displayed measurements. A higher frequency tends to show more oscillations in the data and is better suited for visualizing shorter periods of time. Consequently, displaying data in longer time intervals allows us to read longer measurements more easily.
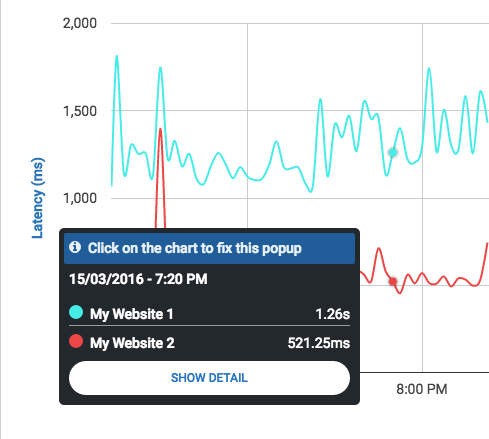
Waterfall Chart Analysis
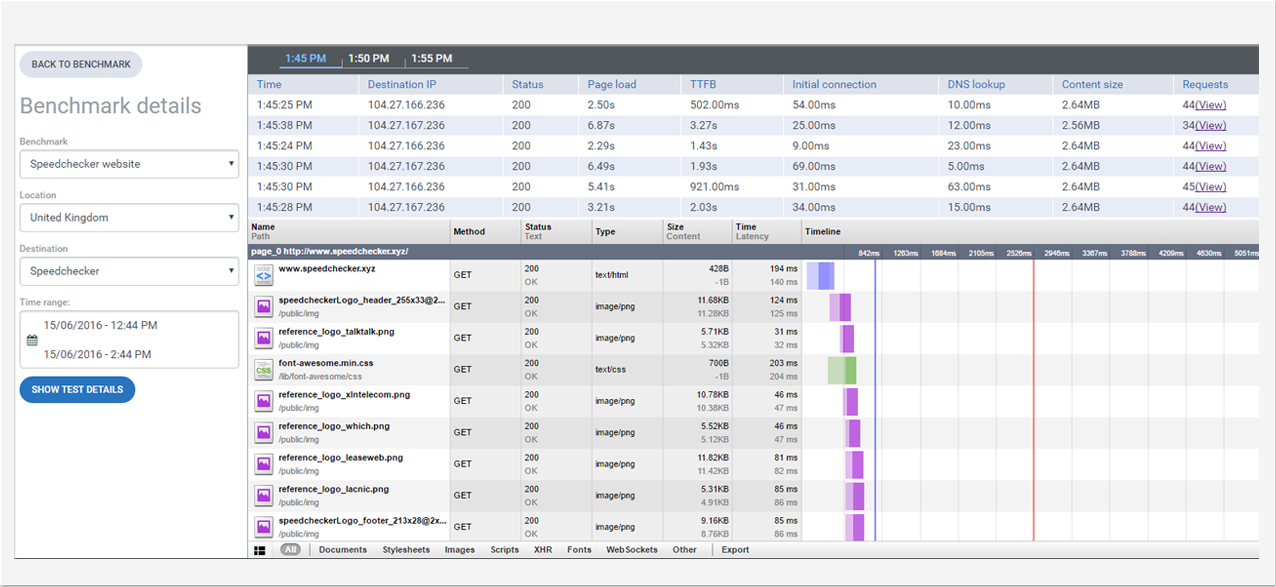
Inside your Benchmark’s results page, just move the mouse pointer along the graph and click on the position where you would like to take a deeper look. The pop-up windows will stay fixed after your click and you can go inside the detailed view by clicking “Show Detail”.
In this view you can see a panel on the left side, where you can choose the benchmark where you would like to take a closer look, the country of the measurements, destination website and the time range for which the results will be shown.
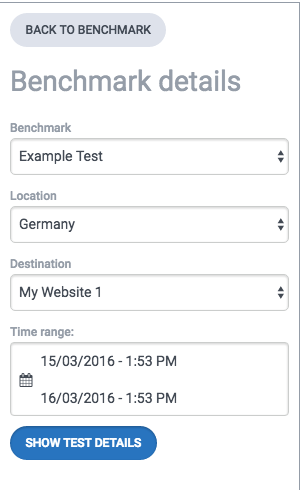
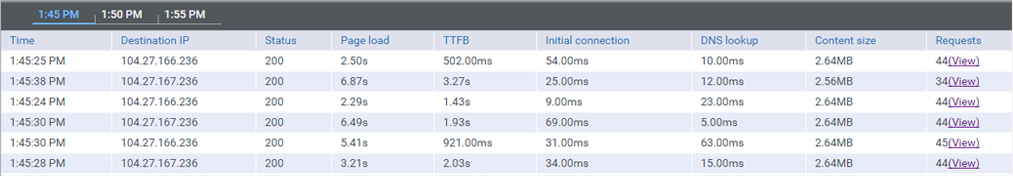
On the top you can see a timeline where after selecting the time-range you can choose with precision the time of the day you want to take a look into. Directly underneath the list of measurements made at that time will appear, showing the details of every single one of them.
When configuring a Page-Load Test, be sure to check the box “Collect resource timing data” before running it.
Troubleshooting

If you are trying to diagnose connectivity problems, you can run traceroute tests specifying any particular Country, ASN or ISP. This way you can detect and identify parts of the Net that aren’t able to reach your services normally.
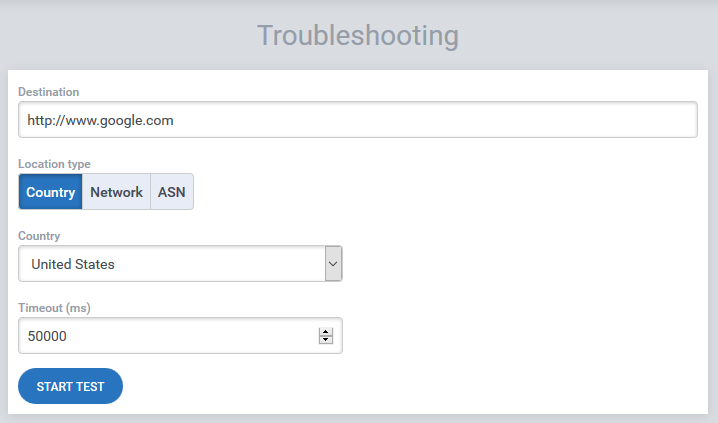
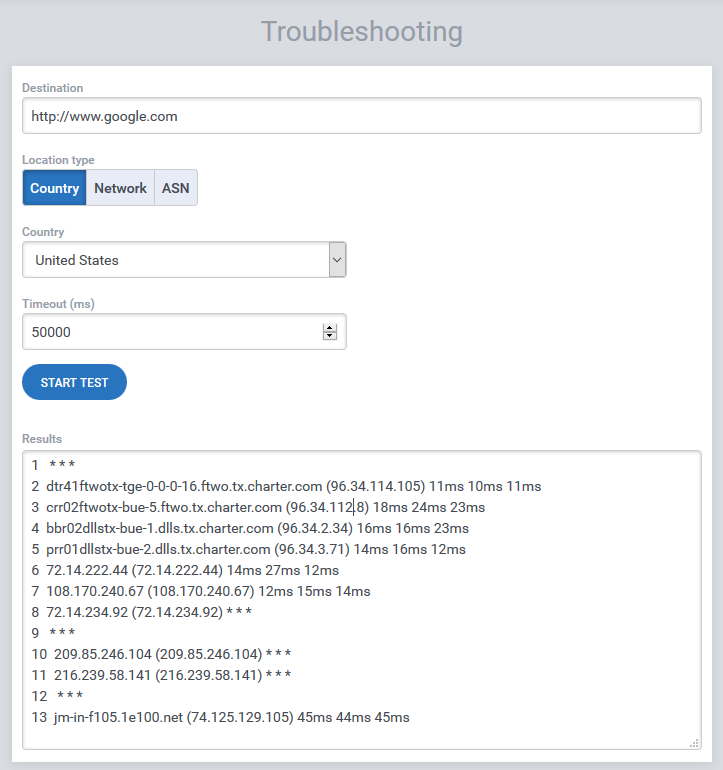
Put the URL you would like to diagnose in the text box and select whether the test should be run from a particular country, network (ISP) or ASN. You can define the timeout parameter in the spin-box below. Hit start and wait for results from our traceroute tool.
Alerts
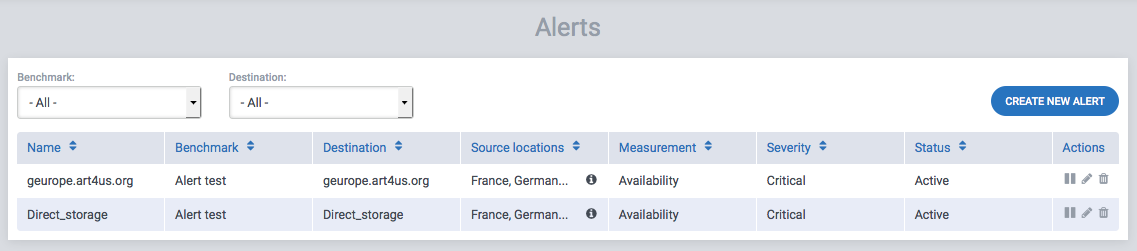
You can set up alerts either by directly clicking the bell icon right to each measurement destination when editing your benchmark, or by clicking “Alerts” in the upper menu bar. The second option will take you first to a Dashboard for Alerts, where you can see all the alerts set up in your CloudPerf account.
Click on Create new Alert and it will take you the next page to input your alert’s parameters.
Source
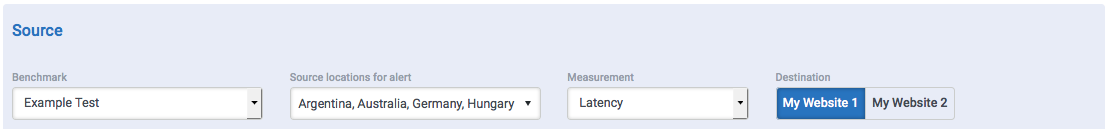
Benchmark
In this drop-down menu you can select for which benchmark this alert will be set up. Optionally you can click on “Create new Benchmark” directly from here before setting up an alert.
Source locations for alert
here you can select for which locations your alert will work. This is limited to only the locations you selected in its respective benchmark. The difference here is that you can set up alerts with different parameters depending on the source’s location.
Measurement
This menu lets you select the kind of measurement you will use to trigger the alert. You can select between Latency, Throughput, Availability and Time to First Byte.
Destination
Use these buttons to select which one of your benchmark’s measurement destinations will trigger this alarm.
Settings

Name
here you can enter the name of your alert to identify it.
Email to alert
enter here the e-mail address to which you want to be notified in case of alert.
Status
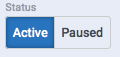
You can interrupt or restart an alert using these buttons.
Severity
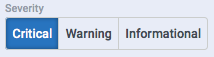
Since you can set up several alerts for the same benchmark, you can set the character or severity of each status update depending on different trigger conditions.
Conditions
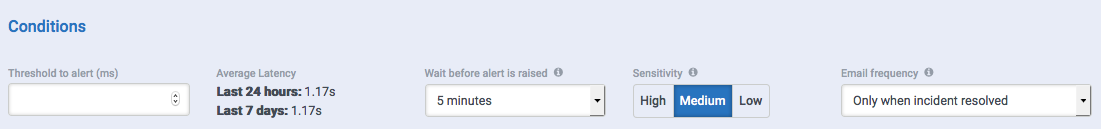
Threshold to alert
This sets the measurement value which will trigger the alert. Depending on the selected type of measurement, the corresponding threshold will be in the corresponding units (ms, Mb/s or % Availability) . Next to this field we can see the average past values for this metric as a reference.
Wait before alert is raised
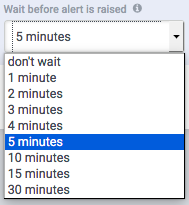
this menu lets you select how long should the alert wait before sending a notification. For example, you can set up an alert as Warning when latency goes high for less than 5 minutes, and you may set up a critical alert if it goes higher for longer.
Sensitivity

this changes the number of measurements considered for raising an alert. Low sensitivity will use the average of 10 measurements triggering the alert. Medium uses the last 5 measurements and High only the last measurement. High sensitivity has the disadvantage of being very prone to produce false positives. It may be very useful for website diagnostics and especially for developers.
Email frequency
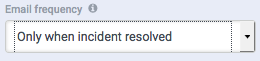
this menu lets you set up how frequently you should receive an e-mail alerting you about the incident of your interest. Possible options are: only once, every five to 60 minutes and never.